UNITED STATES
SECURITIES AND EXCHANGE COMMISSION
Washington, D.C. 20549
SCHEDULE 14A
Proxy Statement Pursuant to Section 14(a)
of the Securities Exchange Act of 1934
(Amendment No. )
Filed by the Registrant x
Filed by a Party other than the Registrant ¨
Check the appropriate box:
| ¨ Preliminary Proxy Statement | ¨ Confidential, for Use of the Commission Only(as permitted by Rule 14a-6(e)(2)) | |
x Definitive Proxy Statement | ||
| ¨ Definitive Additional Materials | ||
| ¨ Soliciting Material Pursuant to §240.14a-12 | ||
EXXON MOBIL CORPORATION
(Name of Registrant as Specified In Its Charter)
(Name of Person(s) Filing Proxy Statement, if other than the Registrant)
Payment of Filing Fee (Check the appropriate box):
| x | No fee required. |
| ¨ | Fee computed on table below per Exchange Act Rules 14a-6(i)(4) and 0-11. |
| (1) | Title of each class of securities to which transaction applies: |
| (2) | Aggregate number of securities to which transaction applies: |
| (3) | Per unit price or other underlying value of transaction computed pursuant to Exchange Act Rule 0-11 (set forth the amount on which the filing fee is calculated and state how it was determined): |
| (4) | Proposed maximum aggregate value of transaction: |
| (5) | Total fee paid: |
| ¨ | Fee paid previously with preliminary materials. |
| ¨ | Check box if any part of the fee is offset as provided by Exchange Act Rule 0-11(a)(2) and identify the filing for which the offsetting fee was paid previously. Identify the previous filing by registration statement number, or the Form or Schedule and the date of its filing. |
| (1) | Amount Previously Paid: |
| (2) | Form, Schedule or Registration Statement No.: |
| (3) | Filing Party: |
| (4) | Date Filed: |
| NOTICE OF | ||||
| ANNUAL MEETING | ||||
| AND PROXY STATEMENT | | |||
| April | ||||
Dear Shareholder:
We invite you to attend the annual meeting of shareholders on Wednesday, May 28, 2008,27, 2009, at the Morton H. Meyerson Symphony Center, 2301 Flora Street, Dallas, Texas 75201. The meeting will begin promptly at 9:00 a.m., Central Time. At the meeting, you will hear a report on our business and vote on the following items:
| Ÿ | Election of directors; |
| Ÿ | Ratification of PricewaterhouseCoopers LLP as independent auditors; |
| Ÿ |
|
| Ÿ | Other matters if properly raised. |
Only shareholders of record on April 4, 2008,6, 2009, or their proxy holders may vote at the meeting. Attendance at the meeting is limited to shareholders or their proxy holders and ExxonMobil’sExxonMobil guests. Only shareholders or their valid proxy holders may address the meeting.
This booklet includes the formal notice of the meeting, proxy statement, and financial statements. The proxy statement tells you about the agenda, procedures, and rules of conduct for the meeting. It also describes how the Board operates, gives information about our director candidates, and provides information about the other items of business to be conducted at the meeting.
Even if you own only a few shares, we want your shares to be represented at the meeting. You can vote your shares by Internet, toll-free telephone call, or proxy card.
To attend the meeting in person, please follow the instructions on page 3.3. A live audiocast of the meeting and a report on the meeting will be available on our Web site atexxonmobil.com.
Sincerely,

|  | |||
| Rex W. Tillerson | ||||
| Secretary | Chairman of the Board |
| Page | ||
| 1 | ||
| 4 | ||
| 4 | ||
| 18 | ||
| 19 | ||
Item 4 – | ||
Item 7 – Shareholder Advisory Vote on Executive Compensation | ||
| 60 | ||
Item | 63 | |
Item | 65 | |
Item | 66 | |
| 68 | ||
| A1 | ||
Who May Vote
Shareholders of ExxonMobil, as recorded in our stock register on April 4, 2008,6, 2009, may vote at the meeting.
How to Vote
You may vote in person at the meeting or by proxy. We recommend you vote by proxy even if you plan to attend the meeting. You can always change your vote at the meeting.
Important Notice Regarding the Availability of Proxy Materials for the Shareholder Meeting to beBe Held on May 28, 2008.27, 2009.
| Ÿ | The |
Electronic Delivery of Proxy Statement and Annual Report
Instead of receiving future copies of these documents by mail, shareholders can elect to receive an e-mail that will provide electronic links to them.the proxy materials. Opting to receive your proxy materials online will save the Company the cost of producing and mailing documents to your home or business, and will also will give you an electronic link to the proxy voting site.
| Ÿ | Shareholders of Record: If you vote on the Internet atwww.investorvote.com/exxonmobil,simply follow the prompts for enrolling in the electronic proxy delivery service. You |
| Ÿ | Beneficial Shareholders: If you hold your shares in a brokerage account, you may also |
How Proxies Work
ExxonMobil’s Board of Directors is asking for your proxy. Giving us your proxy means you authorize us to vote your shares at the meeting in the manner you direct. You may vote for all, some, or none of our director candidates. You may also vote for or against the other proposals, or abstain from voting.
If your shares are held in your name, you can vote by proxy in one of three convenient ways:
| Ÿ | Via Internet: Go towww.investorvote.com/exxonmobiland follow the instructions. You will need to have your proxy card in hand. At this Web site, you can elect to access future proxy statements and annual reports via the Internet. |
| Ÿ | By Telephone: Call toll-free 1-800-652-8683 |
| Ÿ | In Writing: Complete, sign, date, and return your proxy card in the enclosed envelope. |
Your proxy card covers all shares registered in your name and shares held in your Computershare Investment Plan account. If you own shares in the ExxonMobil Savings Plan for employees and retirees, your proxy card also covers those shares.
If you give us your signed proxy but do not specify how to vote, we will vote your shares in favor of our director candidates; in favor of the ratification of the appointment of independent auditors; and against the shareholder proposals.
If you hold shares through someone else, such as a stockbroker, you will receive material from that firm asking how you want to vote. Check the voting form used by that firm to see if it offers Internet or telephone voting.
Voting Shares in the ExxonMobil Savings Plan
The trustee of the ExxonMobil Savings Plan will vote Plan shares as participants direct. To the extent participants do not give instructions, the trustee will vote shares as it thinks best. The proxy card serves to give voting instructions to the trustee.
Revoking a Proxy
You may revoke your proxy before it is voted at the meeting by:
| Ÿ | Submitting a new proxy with a later date via a proxy card, the Internet, or by telephone; |
| Ÿ | Notifying ExxonMobil’s Secretary in writing before the meeting; or, |
| Ÿ | Voting in person at the meeting. |
Confidential Voting
Independent inspectors count the votes. Your individual vote is kept confidential from us unless special circumstances exist. For example, a copy of your proxy card will be sent to us if you write comments on the card.
Quorum
In order to carry on the business of the meeting, we must have a quorum. This means at least a majority of the outstanding shares eligible to vote must be represented at the meeting, either by proxy or in person. Treasury shares, which are shares owned by ExxonMobil itself, are not voted and do not count for this purpose.
Votes Required
| Ÿ | Election of Directors Proposal: A plurality of the votes cast is required for the election of directors. This means that the director nominee with the most votes for a particular seat is elected for that seat. Only votes FOR or WITHHELD count. Abstentions are not counted for purposes of the election of directors. |
Our Corporate Governance Guidelines, which can be found in the Corporate Governance section of our Web site atexxonmobil.com/governance, state that all directors will stand for election at the annual meeting of shareholders. In any non-contested election of directors, any director nominee who receives a greater number of votes WITHHELD from his or her election than votes FOR such election shall tender his or her resignation. Within 90 days after certification of the election results, the Board of Directors will decide, through a process managed by the Board Affairs Committee and excluding the nominee in question, whether to accept the resignation. Absent a compelling reason for the director to remain on the Board, the Board shall accept the resignation. The Board will promptly disclose its decision and, if applicable, the reasons for rejecting the tendered resignation on Form 8-K filed with the Securities and Exchange Commission (SEC).
| Ÿ | Other Proposals: Approval of the Ratification of Independent Auditors proposal and the shareholder proposals requires the favorable vote of a majority of the votes cast. Only votes FOR or AGAINST these proposals count. Abstentions and broker non-votes count for quorum purposes, but not for the voting of these proposals. A “broker non-vote” occurs when a bank, broker, or other |
holder of record holding shares for a beneficial owner does not vote on a particular proposal because that holder does not have discretionary voting power for that particular item and has not received instructions from the beneficial owner. |
Annual Meeting Admission
Only shareholders or their proxy holders and ExxonMobil’sExxonMobil guests may attend the meeting.For safety and security reasons, no cameras, camera phones, recording equipment, electronic devices, large bags, briefcases, or packages will not be permitted in the meeting. In addition each shareholder and ExxonMobil’sExxonMobil guest will be asked to present a valid government-issued picture identification, such as a driver’s license, before being admitted to the meeting.
For registered shareholders, an admission ticket is attached to your proxy card. Please detach and bring the admission ticket with you to the meeting.
If your shares are held in the name of your broker, bank, or other nominee, you must bring to the meeting an account statement or letter from the nominee indicating that you beneficially owned the shares on April 4, 2008,6, 2009, the record date for voting. You may receive an admission ticket in advance by sending a written request with proof of ownership to the address listed under “Contact Information” below.
Shareholders who do not present admission tickets at the meeting will be admitted only upon verification of ownership at the admission counter.
Audiocast of the Annual Meeting
You are invited to visit our Web site atexxonmobil.com to hear the live audiocast of the meeting at 9:00 a.m., Central Time, on Wednesday, May 28, 2008.27, 2009. An archived copy of this audiocast will be available on our Web site for one year.
Conduct of the Meeting
The Chairman has broad responsibility and legal authority to conduct the annual meeting in an orderly and timely manner. This authority includes establishing rules for shareholders who wish to address the meeting. Only shareholders or their valid proxy holders may address the meeting. Copies of these rules will be available at the meeting. The Chairman may also exercise broad discretion in recognizing shareholders who wish to speak and in determining the extent of discussion on each item of business. In light of the number of business items on this year’s agenda and the need to conclude the meeting within a reasonable period of time, we cannot assure that every shareholder who wishes to speak on an item of business will be able to do so.
Dialogue can be better be accomplished with interested parties outside the meeting and, for this purpose, we have provided a method for raising issues and contacting the non-employee directors either in writing or electronically on our Web site atexxonmobil.com/directors. The Chairman may also rely on applicable law regarding disruptions or disorderly conduct to ensure that the meeting is conducted in a manner that is fair to all shareholders. Shareholders making comments during the meeting must do so in English so that the majority of shareholders present can understand what is being said.
Contact Information
If you have questions or need more information about the annual meeting, write to:
Mr. Henry H. HubbleDavid S. Rosenthal
Secretary
Exxon Mobil Corporation
5959 Las Colinas Boulevard
Irving, TX 75039-2298
call us at 1-972-444-1157,
or send a fax to us at 1-972-444-1505.
For information about shares registered in your name or your Computershare Investment Plan account, call ExxonMobil Shareholder Services at 1-800-252-1800 (within the United States, Canada, and Puerto Rico), or 1-781-575-2058 (outside the United States, Canada, and Puerto Rico), or access your account via the Web site atcomputershare.com/www.computershare.com/exxonmobil. We also invite you to visit ExxonMobil’s Web site atexxonmobil.com. Investor information can be found atexxonmobil.com/investor. Web site materials are not part of this proxy solicitation.
Overview
The Board of Directors and its committees perform a number of functions for ExxonMobil and its shareholders, including:
| Ÿ | Overseeing the management of the Company on your behalf; |
| Ÿ | Reviewing ExxonMobil’s long-term strategic plans; |
| Ÿ | Exercising direct decision-making authority in key areas, such as declaring dividends; |
| Ÿ | Selecting the CEO and evaluating the CEO’s performance; and, |
| Ÿ | Reviewing development and succession plans for ExxonMobil’s top executives. |
The Board has adopted Corporate Governance Guidelines that govern the structure and functioning of the Board and set out the Board’s position on a number of governance issues. A copy of our current Corporate Governance Guidelines is posted on our Web site atexxonmobil.com/governance.The Guidelines are also available to any shareholder on request to the Secretary at the address given under “Contact Information” on page 3.
All ExxonMobil directors stand for election at the annual meeting. Non-employee directors cannot stand for election after they have reached age 72, unless the Board makes an exception on a case-by-case basis. Employee directors resign from the Board when they are no longer employed by ExxonMobil.
Director Independence
Our Corporate Governance Guidelines require that a substantial majority of the Board consist of independent directors. In general the Guidelines require that an independent director must have no material relationship with ExxonMobil, directly or indirectly, except as a director. The Board determines independence on the basis of the standards specified by the New York Stock Exchange (NYSE);, the additional categorical standards referenced in our Corporate Governance Guidelines;Guidelines, and other facts and circumstances the Board considers relevant.
The NYSE standards generally provide that a director will not be independent if: (1) the director is, or in the past three years has been, an employee of ExxonMobil; or a member of the director’s immediate family is, or in the past three years has been, an executive officer of ExxonMobil; (2) the director or a member of the director’s immediate family has received more than $100,000$120,000 per year in direct compensation from ExxonMobil other than for service as a director; (3) the director is a current partner or a member of the director’semployee, or an immediate family currentlymember is a current partner, of PricewaterhouseCoopers LLP (PwC), our independent auditors; or an immediate family member is a current employee in PwC’s audit, assurance, or tax compliance practices;of PwC and personally works on ExxonMobil’s audit; or within the past three years the director or an immediate family member has been a PwC partner or employee who worked on ExxonMobil’s audit; (4) the director or a member of the director’s immediate family is, or in the past three years has been, employed as an executive officer of a company where an ExxonMobil executive officer serves on the compensation committee; or, (5) the director or a member of the director’s immediate family is an executive officer of a company that
company that makes payments to, or receives payments from, ExxonMobil in an amount which, in any 12-month period during the past three years, exceeds the greater of $1 million or 2 percent of that other company’s consolidated gross revenues.
ExxonMobil’s Corporate Governance Guidelines also provide that a director will not be independent if a reportable “related person transaction” exists with respect to that director or a member of the director’s family for the current or most recently completed fiscal year. See the Guidelines for Review of Related Person Transactions posted on the Corporate Governance section of our Web site and described in more detail under “Related Person Transactions and Procedures” below.on pages 11-12. The categorical standards provided in the Related Person Transaction Guidelines also serve as ExxonMobil’s additional categorical standards for determining director independence.
The Board has reviewed relevant relationships between ExxonMobil and each non-employee director and director nominee to determine compliance with the NYSE standards and ExxonMobil’s additional categorical standards. The Board has also evaluated whether there are any other facts or circumstances that might impair a director’s independence. Based on that review, the Board has determined that all ExxonMobil non-employee directors and director nominees (M.J. Boskin, L.R. Faulkner, K.C. Frazier, W.W. George, J.R. Houghton, W.R. Howell, R.C. King, P.E. Lippincott, M.C. Nelson, S.J. Palmisano, S.S Reinemund, W.V. Shipley, and E.E. Whitacre, Jr.) are independent. The Board has also determined that each member of the Audit, Board Affairs, Compensation, and CompensationPublic Issues and Contributions Committees (see membership table below) is independent.
In recommending that each director and nominee be found independent, the Board Affairs Committee reviewed the following transactions, relationships, or arrangements. All matters described below fall within the NYSE and ExxonMobil independence standards.
| Name | Matters Considered | |
K.C. Frazier | Ordinary course business with Merck (purchases of pharmaceutical products; sales of chemicals and oils) | |
M.C. Nelson | Ordinary course business with Carlson (purchases of travel services; sales of lubricants) | |
S.J. Palmisano | Ordinary course business with IBM (purchases of consulting and IT maintenance |
Presiding Director
Mr. Palmisano currently serves as ExxonMobil’s Presiding Director. The Presiding Director is selected annually by the other independent members of the Board of Directors. It is normally expected that the same director will serve as Presiding Director for at least two years. The Presiding Director acts as a liaison with the Chairman, in consultation with the other directors.
Specific duties of the Presiding Director include: chairing executive sessions of the non-employee directors and providing feedback from such sessions to the Chairman as appropriate; chairing meetings of the Board in the absence of the Chairman and President; and reviewing in advance and consulting with the Chairman regarding the schedule and agenda for all Board meetings as well as reviewing in advance the materials to be distributed to the directors for Board meetings.
Executive sessions may be convened by the Presiding Director at his or her discretion and will be convened if requested by any other director. Any non-employee director may raise issues for discussion at an executive session.
Board Meetings and Committees; Annual Meeting Attendance
The Board met 10 times in 2007.2008. ExxonMobil’s incumbent directors, on average, attended approximately 9796 percent of Board and committee meetings during 2007;2008; and no director attended less than 75 percent of such meetings. ExxonMobil’s non-employee directors held four executive sessions in 2008.
As specified in our Corporate Governance Guidelines, it is ExxonMobil’s policy that directors should make every effort to attend the annual meeting of shareholders. All incumbent directors attended last year’s meeting except for Dr. Faulkner,Mr. Whitacre, who was first elected to the Board in JanuaryMay 2008.
ExxonMobil’s non-employee directors held five executive sessions of the independent directors in 2007. Normally, the Chair of the Board Affairs Committee (Mr. Shipley) or the Chair of the Compensation Committee (Mr. Howell) presides at executive sessions on a rotational basis, but the non-employee directors may, in light of the subject matter under discussion, select another Presiding Director for a particular session.
The Board appoints committees to help carry out its duties. Board committees work on key issues in greater detail than would be possible at full Board meetings. Only non-employee directors may serve on the Audit, Compensation, Board Affairs, Contributions, and Public Issues and Contributions Committees. Each Committeecommittee has a written charter. The charters are posted on the Corporate Governance section of our Web site and are available free of charge on request to the Secretary at the address given under “Contact Information” on page3.
The table below shows the current membership of each Board committee and the number of meetings each Committeecommittee held in 2007.2008.
| Director | Audit | Compensation | Board Affairs | Contributions | Finance | Public Issues | Executive(1) | Audit | Compensation | Board Affairs | Finance | Public Issues and | Executive(1) | |||||||||||||
M.J. Boskin | Ÿ | Ÿ | Ÿ | Ÿ | Ÿ | |||||||||||||||||||||
L.R. Faulkner | Ÿ | Ÿ | Ÿ | Ÿ | ||||||||||||||||||||||
W.W. George | Ÿ | Ÿ | Ÿ | C | Ÿ | |||||||||||||||||||||
J.R. Houghton | C | Ÿ | Ÿ | C | Ÿ | Ÿ | ||||||||||||||||||||
W.R. Howell | C | Ÿ | Ÿ | |||||||||||||||||||||||
R.C. King | Ÿ | Ÿ | C | Ÿ | C | Ÿ | ||||||||||||||||||||
P.E. Lippincott | Ÿ | Ÿ | Ÿ | |||||||||||||||||||||||
M.C. Nelson | Ÿ | C | Ÿ | Ÿ | Ÿ | Ÿ | Ÿ | |||||||||||||||||||
S.J. Palmisano | Ÿ | Ÿ | Ÿ | Ÿ | Ÿ | |||||||||||||||||||||
S.S Reinemund | Ÿ | Ÿ | Ÿ | Ÿ | ||||||||||||||||||||||
W.V. Shipley | C | Ÿ | C | Ÿ | ||||||||||||||||||||||
R.W. Tillerson | C | C | C | C | ||||||||||||||||||||||
2007 Meetings | 11 | 8 | 6 | 3 | 2 | 4 | 1 | |||||||||||||||||||
E.E. Whitacre, Jr. | Ÿ | Ÿ | ||||||||||||||||||||||||
2008 Meetings | 11 | 7 | 9 | 2 | 4 | 0 | ||||||||||||||||||||
| C | = Chair |
| Ÿ | = Member |
| (1) | Other directors serve as alternate members on a rotational basis. |
Below is additional information about each Board committee.
Board Affairs Committee
The Board Affairs Committee serves as ExxonMobil’s nominating and corporate governance committee. The Committee recommends director candidates, reviews non-employee director compensation, and reviews other corporate governance practices, including the Corporate Governance Guidelines. The Committee also reviews any issue involving an executive officer or director under ExxonMobil’s Code of Ethics and Business Conduct and administers ExxonMobil’s Related Person Transaction Guidelines.
The Committee has adopted Guidelines for the Selection of Non-Employee Directors that describe the qualifications the Committee looks for in director candidates. These Selection Guidelines, as well as the Committee’s charter, are posted on the Corporate Governance section of our Web site.
The Selection Guidelines provide that candidates for non-employee director of ExxonMobil should be individuals who have achieved prominence in their fields, with experience and demonstrated expertise in managing large, relatively complex organizations, and/or, in a professional or scientific capacity, be accustomed to dealing with complex situations preferably with worldwide scope.
A substantial majority of the Board must meet the independence standards described in the Corporation’s Corporate Governance Guidelines, and all candidates must be free from any relationship with
management or the Corporation that would interfere with the exercise of independent judgment. Candidates should be committed to representing the interests of all shareholders and not any particular constituency.
The Board believes a director should be able to serve for several years. Candidates should bring integrity, insight, energy, and analytical skills to Board deliberations, and must have a commitment to devote the necessary time and attention to oversee the affairs of a corporation as large and complex as ExxonMobil. ExxonMobil recognizes that the strength and effectiveness of the Board reflect the balance,
experience, and diversity of the individual directors; their commitment; and importantly, the ability of directors to work effectively as a group in carrying out their responsibilities. ExxonMobil seeks candidates with diverse backgrounds who possess knowledge and skills in areas of importance to the Corporation. The Board must include members with particular experience required for service on key Board committees, as described in the committee charters on our Web site.
The Committee identifies director candidates primarily through recommendations made by the non-employee directors. These recommendations are developed based on the directors’ own knowledge and experience in a variety of fields, and research conducted by ExxonMobil staff at the Committee’s direction. The Committee has also engaged an executive search firm to help the Committee identify new director candidates. The firm identifies potential director candidates for the Committee to consider and helps research candidates identified by the Committee. Additionally the Committee considers recommendations made by the employee directors, shareholders, and others, including search firms. The Committee has the authority to engage consultants to help identify or evaluate potential director nominees.others. All recommendations, regardless of the source, are evaluated on the same basis against the criteria contained in the Selection Guidelines.
Dr. FaulknerMr. Frazier was initially suggested as a candidate by the Chief Executive Officerexecutive search firm, Heidrick & Struggles, and subsequently recommended for nomination by the incumbent non-employee directors on the Board Affairs Committee. The recommendation of Mr. Whitacre was made by the incumbent non-employee directors on the Board Affairs Committee.
Shareholders may send recommendations for director candidates to the Secretary at the address given under “Contact Information” on page3. A submission recommending a candidate should include:
| Ÿ | Sufficient biographical information to allow the Committee to evaluate the candidate in light of the Selection Guidelines; |
| Ÿ | Information concerning any relationship between the candidate and the shareholder recommending the candidate; and, |
| Ÿ | Material indicating the willingness of the candidate to serve if nominated and elected. |
The procedures by which shareholders may recommend nominees have not changed materially since last year’s proxy statement.
The Committee is also responsible for reviewing and making recommendations to the Board regarding the compensation of the non-employee directors. The Committee uses an independent consultant, Pearl Meyer & Partners, to provide information on current developments and practices in director compensation. Pearl Meyer & Partners is the same consultant retained by the Compensation Committee to advise on executive compensation, but performs no other work for ExxonMobil.
Audit Committee
The Audit Committee oversees accounting and internal control matters. Its responsibilities include oversight of:
| Ÿ | Management’s conduct of the Corporation’s financial reporting process; |
| Ÿ | The integrity of the financial statements and other financial information provided by the Corporation to the SEC and the public; |
| Ÿ | The Corporation’s system of internal accounting and financial controls; |
| Ÿ | The Corporation’s compliance with legal and regulatory requirements; |
| Ÿ | The performance of the Corporation’s internal audit function; |
| Ÿ | The independent auditors’ qualifications, performance, and independence; and, |
| Ÿ | The annual independent audit of the Corporation’s financial statements. |
The Committee has direct authority and responsibility to appoint (subject to shareholder ratification), compensate, retain, and oversee the independent auditors.
The Committee also prepares the report that the SEC rules require be included in the Corporation’s annual proxy statement. This report is on pages 46-47.49-50.
The Committee has adopted specific policies and procedures for pre-approving fees paid to the independent auditors. These policies and procedures, as well as the Committee’s charter, are posted on the Corporate Governance section of our Web site.
The Board has determined that all members of the Committee are financially literate within the meaning of the NYSE standards, and that Dr. Boskin, Dr. Faulkner, Mr. Houghton, Mr. Lippincott, and Mr. Reinemund are “audit committee financial experts” as defined in the SEC rules.
Compensation Committee
The Compensation Committee oversees compensation for ExxonMobil’s senior executives, including their salary, bonus, and incentive awards, and succession plans for key executive positions. The Committee’s charter is available on the Corporate Governance section of our Web site.
During 2007,2008 the Committee established the ceiling for the 20072008 short term and long term incentive award programs;programs, endorsed the salary program for 2008;2009, reviewed the individual performance and contributions of each senior executive;executive, granted individual incentive awards and set salaries for the senior executives;executives, and reviewed progress on executive development and succession planning for senior positions. In addition, the Committee endorsed several program changes as described on page 32.
The Compensation Committee’s report is on page19.
The Committee does not delegate its responsibilities with respect to ExxonMobil’s executive officers and other senior executives (approximately 2425 positions). For other employees, the Committee delegates authority to determine individual salaries and incentive awards to a committee consisting of the Chairman and the Senior Vice Presidents of the Corporation. That committee’s actions are subject to a salary budget and aggregate annual ceilings on cash and equity incentive awards established by the Compensation Committee.
The Committee utilizes the expertise of an external independent consultant, Pearl Meyer & Partners, whom the Committee retains and works with during the year. At the direction of the Chair of the Compensation Committee, the consultant provides the following services:
| Ÿ | Attends meetings of the Compensation Committee. |
| Ÿ | Makes an annual presentation to the Compensation Committee regarding: |
| – | General trends in executive compensation across industries, particularly trends that reflect a change in compensation practices. The consultant advises the Committee on whether changes in compensation practices are relevant to ExxonMobil’s compensation programs. |
| – | A perspective on the structure and competitive standing of ExxonMobil’s compensation program for senior executives. |
| Ÿ | Participates in the Committee’s deliberations regarding compensation for Named Executive Officers that include items such as: |
| – | How to interpret the level of compensation of each Named Executive Officer compared to similar positions across industries. |
| – | The appropriate level of each element of compensation for individual Named Executive Officers considering their career experience and tenure in their positions, as well as general performance of the Company within the industry. |
| – | The pace at which compensation levels should be adjusted over future years. |
| – | How to weigh or consider the impact of a compensation change today on future retirement income. |
| – | The interpretation of issues involving executive compensation raised by shareholders and the appropriate responses from management. |
| – | The relationship between compensation and executive succession planning. |
| – | How the Committee should emphasize or weigh one element of compensation versus another to address the long-term nature of the business and long planning lead times. |
| Ÿ | Prepares the analysis of comparator company compensation used by the Compensation Committee. |
The input of the independent consultant is given serious consideration as part of the Committee’s decision-making process but is not assigned a weight versus the other matters considered by the Committee as described in the “Compensation Discussion and Analysis” beginning on page 19.20.
In addition at the direction of the Chair of the Board Affairs Committee, Pearl Meyer & Partners provides an annual survey of non-employee director compensation for use by that Committee.
ExxonMobil management does not use Pearl Meyer & Partners to advise on ExxonMobil’s general employee compensation and benefit programs. The Chair of the Compensation Committee negotiatesretains sole discretion to hire and fire the independent consultant and to negotiate the terms of Pearl Meyer & Partners’the consultant’s engagement.
The Committee meets with ExxonMobil’s ChairmanCEO and other senior executives during the year to review the Corporation’s business results and progress against strategic plans. The Committee uses this input to help determine the aggregate annual ceilings to be set for the Corporation’s cash and equity incentive award programs. The ChairmanCEO also provides input to the Committee regarding performance assessments for ExxonMobil’s other senior executives and makes recommendations to the Committee with respect to salary and incentive awards for these executives and succession planning for senior positions.
The Committee uses tally sheets to assess total compensation for the Corporation’s senior executives under different scenarios. The tally sheets value all elements of cash compensation; incentive awards, including restricted stock grants; the annual change in pension value; and other benefits and perquisites. The tally sheets also display the value of outstanding awards and lump sum pension estimates. For tally sheet purposes, the Committee considers restricted stock awards on the basis of grant date fair value as shown in the “Grants of Plan-Based Awards” table, not on the financial accounting method used for the “Summary Compensation Table.”
See page 26 pages 28-30for additional information on tally sheets and other analytical tools used by the “Compensation Discussion and Analysis” beginning on page 19 forCommittee to facilitate compensation decisions.
For more information on the Committee’s approach to executive compensation and the decisions made by the Committee for 2007.
Advisory Committee on Contributions
The Advisory Committee on Contributions reviews the level of ExxonMobil’s support for education and other public service programs, including the Company’s contributions2008, refer to the ExxonMobil Foundation. The Foundation works to improve the quality of education in the U.S. at all levels, with special emphasis“Compensation Discussion and Analysis” beginning on math and science. The Foundation also supports the Company’s other cultural and public service giving. The Committee’s charter is available on the Corporate Governance section of our Web site.page 20.
Finance Committee
The Finance Committee reviews ExxonMobil’s financial policies and strategies, including our capital structure, dividends, and share repurchasepurchase program. The Committee authorizes the issuance of corporate debt subject to limits set by the Board. The Committee’s charter is available on the Corporate Governance section of our Web site.
Public Issues and Contributions Committee
The Public Issues Committee and the Advisory Committee on Contributions were combined in 2008. This Committee reviews the effectiveness of the Corporation’s policies, programs, and practices with respect to safety, health, the environment, and social issues. The Committee hears reports
from operating units on safety and environmental activities. The Committeeactivities, and also visits operating sites to observe and comment on current operating practices. In addition the Committee reviews the level of ExxonMobil’s support for education and other public service programs, including the Company’s contributions to the ExxonMobil Foundation. The Foundation works to improve the quality of education in the United States at all levels, with special emphasis on math and science. The Foundation also supports the Company’s other cultural and public service giving. The Committee’s charter is available on the Corporate Governance section of our Web site.
Executive Committee
The Executive Committee has broad power to act on behalf of the Board. In practice the Committee meets only when it is impractical to call a meeting of the full Board.
Shareholder Communications
The Board Affairs Committee has approved and implemented procedures for shareholders and other interested persons to send communications to individual directors, including the Presiding Director, Board Committees, or the non-employee directors as a group.
| Ÿ | Written Communications: Written correspondence should be addressed to the director or directors in care of the Secretary at the address given under “Contact Information” on page3. All correspondence either |
| Ÿ | Electronic Communications: You may |
Code of Ethics and Business Conduct
The Board maintains policies and procedures (which we refer to in this proxy statement as the “Code”) that represent both the code of ethics for the principal executive officer, principal financial officer, and principal accounting officer under SEC rules, and the code of business conduct and ethics for directors, officers, and employees under NYSE listing standards. The Code applies to all directors, officers, and employees. The Code includes a Conflicts of Interest Policy under which directors, officers, and employees are expected to avoid any actual or apparent conflict between their own personal interests and the interests of the Corporation.
The Code is posted on the Corporate Governance section of ourExxonMobil Web site atexxonmobil.com/governance and is available free of charge on request to the Secretary at the address given under “Contact Information” on page3. The Code is also included as an exhibit to ourAnnual Report on Form 10-K. Any amendment of the Code will be posted promptly on our Web site.
The Corporation maintains procedures for administering and reviewing potential issues under the Code, including procedures that allow employees to make complaints without identifying themselves. The Corporation also conducts periodic mandatory business practice training sessions and requires each regular employee and non-employee director to make an annual compliance certification.
The Board Affairs Committee will initially review any suspected violation of the Code involving an executive officer or director and will report its findings to the Board. The Board does not envision that any waiver of the Code will be granted. Should such a waiver occur, it will be promptly disclosed on our Web site.
Related Person Transactions and Procedures
In accordance with SEC rules, ExxonMobil maintains Guidelines for Review of Related Person Transactions. These Guidelines are available on the Corporate Governance section of our Web site.
In accordance with the Related Person Transaction Guidelines, all executive officers, directors, and director nominees are required to identify, to the best of their knowledge after reasonable inquiry, business and financial affiliations involving themselves or their immediate family members that could reasonably be expected to give rise to a reportable related person transaction. Covered persons must also advise the Secretary of the Corporation promptly of any change in the information provided, and will be asked periodically to review and re-affirm their information.
For the above purposes, “immediate family member” includes a person’s spouse, parents, siblings, children, in-laws, and step-relatives.
Based on this information, we review the Company’s own records and make follow-up inquiries as may be necessary to identify potentially reportable transactions. A report summarizing such transactions and including a reasonable level of detail is then provided to the Board Affairs Committee. The Committee oversees the Related Person Transaction Guidelines generally and reviews specific items to assess materiality.
In assessing materiality for this purpose, information will be considered material if, in light of all the circumstances, there is a substantial likelihood a reasonable investor would consider the information important in deciding whether to buy or sell ExxonMobil stock or in deciding how to vote shares of ExxonMobil stock. A director will abstain from the decision on any transactions involving that director or his or her immediate family members.
Under SEC rules, certain transactions are deemed not to involve a material interest (including transactions in which the amount involved in any 12-month period is less than $120,000 and transactions with entities where a related person’s interest is limited to service as a non-employee director). In addition based on a consideration of ExxonMobil’s facts and circumstances, the Committee will presume that the following transactions do not involve a material interest for purposes of reporting under SEC rules:
| Ÿ | Transactions in the ordinary course of business with an entity for which a related person serves as an executive officer,provided(1) the affected director or executive officer did not participate in the decision on the part of ExxonMobil to enter into such transactions; and, (2) the amount involved in any related category of transactions in a 12-month period is less than 1 percent of the entity’s gross revenues. |
| Ÿ | Grants or membership payments in the ordinary course of business to nonprofit organizations,provided(1) the affected director or executive officer did not participate in the decision on the part of ExxonMobil to make such payments; and, (2) the amount of general-purpose grants in a 12-month period is less than 1 percent of the recipient’s gross revenues. |
| Ÿ | Payments under ExxonMobil plans and arrangements that are available generally to U.S. salaried employees (including contributions under ExxonMobil’s Educational and Cultural Matching Gift Programs and payments to providers under ExxonMobil health care plans). |
| Ÿ | Employment by ExxonMobil of a family member of an executive officer,providedthe executive officer does not participate in decisions regarding the hiring, performance evaluation, or compensation of the family member. |
Transactions or relationships not covered by the above standards will be assessed by the Committee on the basis of the specific facts and circumstances.
The following disclosures are made as of February 25, 2009, the date of the most recent Board Affairs Committee review of potential related person transactions.
ExxonMobil and its affiliates have about 81,00080,000 employees around the world and employees related by birth or marriage may be found at all levels of the organization. Two currentretired executive officers have family members who are also employed by the Corporation: J.S. Simon (Senior(formerly Senior Vice President and Director) has a son-in-law who works for ExxonMobil Fuels Marketing Company, and H.H. Hubble (Vice(formerly Vice President, Investor Relations and Secretary) has a son who works for ExxonMobil Development Company.
ExxonMobil employees do not receive preferential treatment by reason of being related to an executive officer, and executive officers do not participate in hiring, performance evaluation, or compensation decisions for family members. ExxonMobil’s employment guidelines statestate: “Relatives of Company employees may be employed on a non-preferential basis. However an employee should not be employed by or assigned to work under the direct supervision of a relative, or to report to a supervisor who in turn reports to a relative of the employee.” Accordingly, consistent with ExxonMobil’s Related Person Transaction Guidelines, we do not consider the relationships noted above to be material within the meaning of the related person transaction disclosure rules.
P.T. Mulva (Vice President and Controller) has a brother currently serving as Chairman and CEO of ConocoPhillips. As is the case with most other major companies in the oil and gas industry, ExxonMobil has a variety of business transactions with ConocoPhillips. These transactions include routine purchases and sales of crude oil, petroleum products, and pipeline transportation capacity. Affiliates of ExxonMobil and ConocoPhillips have joint ownership of a refinery in Germany and a number of pipelines, terminals, emergency response companies, and service companies, and also have undivided interests in a variety of exploration, development, and production projects. All of these transactions are entered into in the ordinary course of business without influence from P.T. Mulva. Neither P.T. Mulva nor, to our knowledge after reasonable inquiry, his brother, has any interest in these transactions different from the general interest of other employees and shareholders. Accordingly, consistent with ExxonMobil’s Related Person Transaction Guidelines, we do not consider these transactions to be material within the meaning of the related person transaction disclosure rules.
S.R. LaSala (Vice President and General Tax Counsel) has a son who is a partner of a law firm that performs work for ExxonMobil. Mr. LaSala is not involved in decisions to retain the firm, and, therefore, we do not consider the relationship to be material within the meaning of the related person transaction disclosure rules.
S.J. Glass, Jr. (Vice President) has a brother who is a partner of a law firm that performs work for ExxonMobil. Mr. Glass is not involved in decisions to retain the firm, and, therefore, we do not consider the relationship to be material within the meaning of the related person transaction disclosure rules.
The Board Affairs Committee also reviewed ExxonMobil’s ordinary course business with companies for which non-employee directors serve as executive officers and determined that, in accordance with the categorical standards described above, none of those matters represent reportable related person transactions. See “Director Independence” on page4.
We are not aware of any related person transaction required to be reported under applicable SEC rules since the beginning of the last fiscal year where our policies and procedures did not require review, or where such policies and procedures were not followed.
The Corporation’s Related Person Transaction Guidelines are intended to assist the Corporation in complying with its disclosure obligations under SEC rules. These procedures are in addition to, not in lieu of, the Corporation’s Code of Ethics and Business Conduct.
ITEM 1 –ELECTION– ELECTION OF DIRECTORS
The Board of Directors has nominated the director candidates named on the following pages. Personal information on each of our nominees is also provided. All of our nominees currently serve as ExxonMobil directors except Mr. Whitacre,Frazier, who has been nominated by the Board for first election as a director at the annual meeting. Dr. Faulkner was elected by the Board in January 2008. Messrs. Howell, Lippincott, and Simon have reached retirement age and are not standing for re-election. Messrs. Houghton and Shipley, havewho previously reached the usual retirement age, but are not standing for re-election on an exception basis at the request of the Board.this year.
If a director nominee becomes unavailable before the election, your proxy authorizes the people named as proxies to vote for a replacement nominee if the Board names one.
The Board recommends you vote FOR each of the following candidates:
Michael J. Boskin
Age Director since 1996 | Principal Occupation: T.M. Friedman Professor of Economics and Senior Fellow, Hoover Institution, Stanford University
Public Company Directorships: | |
Larry R. Faulkner
Age Director since 2008 | Principal
Public Company | |
Kenneth C. Frazier
Age 54 Director nominee | Principal Occupation: Executive Vice President and President, Global Human Health, Merck & Co. Business Experience: Mr. Frazier was elected Executive Vice President and President, Global Human Health, at Merck in 2007, and Executive Vice President and General Counsel in 2006. He served as Senior Vice President and General Counsel at Merck from 1999 to 2006. Public Company Directorships: None | |
William W. George
Age Director since 2005 | Principal Occupation: Professor of Management Practice, Harvard University
Public Company Directorships: Goldman | |
|
| |
Reatha Clark King
Age Director since 1997 | Principal
| |||
Marilyn Carlson Nelson
Age Director since 1991 | Principal
Company | |||
Samuel J. Palmisano
Age Director since 2006 Presiding Director since 2008 | Principal
Public Company | |||
Steven S Reinemund
Age Director since 2007 | Principal Occupation:
Public Company Directorships: | |
|
| |
Rex W. Tillerson
Age Director since 2004 | Principal
Public Company | |
Edward E. Whitacre, Jr.
Age Director | Principal
Public Company Directorships: Burlington Northern Santa | |
Director compensation elements are designed to:
| Ÿ | Ensure alignment with long-term shareholder interests; |
| Ÿ | Ensure the Company can attract and retain outstanding director candidates who meet the selection criteria outlined in the Guidelines for Selection of Non-Employee Directors, which can be found |
| Ÿ | Recognize the substantial time commitments necessary to oversee the affairs of the Corporation; and, |
| Ÿ | Support the independence of thought and action expected of directors. |
Non-employee director compensation levels are reviewed by the Board Affairs Committee each year, and resulting recommendations are presented to the full Board for approval. The Committee uses an independent consultant, Pearl Meyer & Partners, to provide information on current developments and practices in director compensation. Pearl Meyer & Partners is the same consultant retained by the Compensation Committee to advise on executive compensation, but performs no other work for ExxonMobil.
ExxonMobil employees receive no extraadditional pay for serving as directors.
Non-employee directors receive compensation consisting of cash and equity in the form of restricted stock.
In 2007, the base cash retainer for non-employee directors was $75,000 per year. Members of the Audit and Compensation Committees received a fee of $15,000 per year, and the Chairs of those Committees received an additional fee of $10,000 per year. For other Committees, non-employee directors received $8,000 per year for each Committee on which they served, and the Chairs received an additional fee of $7,000 per year.
Effective January 1, 2008, non-employee director cash compensation was restructured to pay a higher base fee of $100,000 per year and to eliminate per committee and committee chair fees except for the Chairs of the Audit and Compensation Committees ($10,000).
Through 2007, non-employee directors could defer all or part of their cash compensation either in ExxonMobil notional stock with dividend equivalents, or in a deferred account earning interest at the prime rate. As of year-end 2007, the ability to defer director fees has been terminated. Accrued deferred account balances are being returned to participants in one or two annual installments that commenced in January 2008.
No fees are paid to members of the Executive Committee. Non-employee directors are also reimbursed for reasonable expenses incurred to attend board meetings or other functions relating to their responsibilities as a director of Exxon Mobil Corporation.
In additionThe annual cash retainer for non-employee directors is $100,000 per year. Committee and Committee Chair fees were eliminated in 2007, except for the Chairs of the Audit and Compensation Committees (who receive an additional $10,000 per year). The purpose of this change was to simplify the fees described above, we pay anon-employee director compensation package.
As of year-end 2007, the program in which non-employee directors could defer their cash compensation was terminated. Accrued deferred account balances were returned to participants in one or two annual installments that commenced in January 2008.
A significant portion of director compensation is paid in restricted stock to strongly align director compensation with the long-term interests of shareholders. Through 2007, each incumbent non-employee director except for Dr. Faulkner, who was first elected to the Board in January 2008, received an annual award of 4,000 shares of restricted stock. Effective January 1, 2008, theThe annual restricted stock award grant was reduced from 4,000 shares tofor incumbent non-employee directors is 2,500 to maintain alignment with equity compensation paid by comparator companies. In addition, eachshares. A new non-employee director receives a one-time grant of 8,000 shares of restricted stock upon first being elected to the Board.
While on the Board, the non-employee director receives the same cash dividends on restricted shares as a holder of regular common stock, but the non-employee director is not allowed to sell the shares. The restricted shares may be forfeited if the non-employee director leaves the Board early, i.e., before retirement age of 72, as specified for non-employee directors.
Current and former non-employee directors of Exxon Mobil Corporation are eligible to participate in the ExxonMobil Foundation’s Educational and Cultural Matching Gift Programs under the same terms as the Corporation’s U.S. employees.
Director Compensation for 20072008
Name | Fees Earned or Paid in Cash ($) | Stock Awards ($)(a) | Option Awards ($) | Non-Equity Incentive Plan Compensation ($) | Change in Earnings ($)(b) | Other Compensation ($)(c) | Total ($) | Fees Earned or Paid in Cash ($) | Stock Awards ($)(a) | Option Awards ($) | Non-Equity Incentive Plan Compensation ($) | Change in Earnings ($) | Other Compensation ($)(b) | Total ($) | ||||||||||||||
M.J. Boskin | 104,182 | 298,540 | 0 | 0 | 0 | 318 | 403,040 | 100,000 | 234,163 | 0 | 0 | 0 | 350 | 334,513 | ||||||||||||||
L.R. Faulkner | 92,033 | 687,280 | 0 | 0 | 0 | 350 | 779,663 | |||||||||||||||||||||
W.W. George | 106,000 | 298,540 | 0 | 0 | 0 | 318 | 404,858 | 105,934 | 234,163 | 0 | 0 | 0 | 350 | 340,447 | ||||||||||||||
J.R. Houghton | 111,297 | 298,540 | 0 | 0 | 0 | 318 | 410,155 | 110,000 | 234,163 | 0 | 0 | 0 | 350 | 344,513 | ||||||||||||||
W.R. Howell | 114,181 | 298,540 | 0 | 0 | 24,198 | 318 | 437,237 | 44,725 | 234,163 | 0 | 0 | 0 | 350 | 279,238 | ||||||||||||||
R.C. King | 112,999 | 298,540 | 0 | 0 | 4,830 | 318 | 416,687 | 100,000 | 234,163 | 0 | 0 | 0 | 350 | 334,513 | ||||||||||||||
P.E. Lippincott | 101,297 | 298,540 | 0 | 0 | 0 | 318 | 400,155 | 40,659 | 234,163 | 0 | 0 | 0 | 350 | 275,172 | ||||||||||||||
H.A. McKinnell | 40,798 | 298,540 | 0 | 0 | 3,909 | 318 | 343,565 | |||||||||||||||||||||
M.C. Nelson | 106,000 | 298,540 | 0 | 0 | 0 | 318 | 404,858 | 100,000 | 234,163 | 0 | 0 | 0 | 350 | 334,513 | ||||||||||||||
S.J. Palmisano | 106,000 | 298,540 | 0 | 0 | 0 | 318 | 404,858 | 100,000 | 234,163 | 0 | 0 | 0 | 350 | 334,513 | ||||||||||||||
S.S Reinemund | 57,615 | 387,357 | 0 | 0 | 0 | 318 | 445,290 | 100,000 | 510,846 | 0 | 0 | 0 | 350 | 611,196 | ||||||||||||||
W.V. Shipley | 104,181 | 298,540 | 0 | 0 | 0 | 318 | 403,039 | 100,000 | 234,163 | 0 | 0 | 0 | 350 | 334,513 | ||||||||||||||
E.E. Whitacre, Jr. | 59,341 | 418,670 | 0 | 0 | 0 | 350 | 478,361 | |||||||||||||||||||||
| (a) | In accordance with SEC rules, the valuation of stock awards in this table represents the compensation cost of awards recognized for financial statement purposes for |
| Each director (other than Dr. Faulkner and Mr. |
| Dr. Faulkner received a one-time grant of 8,000 restricted shares upon being first elected to the Board in January 2008. The compensation cost recognized for this award and shown in the table for 2008 is the same as the grant date fair value of this grant, which was $687,280. |
| Mr. Reinemund received a one-time grant of 8,000 restricted shares upon being first elected to the Board in May 2007. The compensation cost recognized for this award and shown in the table for 2008 is five-twelfths of the grant date fair value of this grant in 2007, which was $276,683. |
| Mr. Whitacre received a one-time grant of 8,000 restricted shares upon being first elected to the Board in May 2008. The compensation cost recognized for this award and shown in the table for 2008 is seven-twelfths of the grant date fair value of this grant |
| At year-end |
| Name | Restricted Shares (#) | |
M.J. Boskin | ||
L.R. Faulkner | 8,000 | |
W.W. George | ||
J.R. Houghton | ||
| ||
R.C. King | ||
| ||
M.C. Nelson | ||
S.J. Palmisano | ||
S.S Reinemund | ||
W.V. Shipley | ||
E.E. Whitacre, Jr. | 8,000 |
| (b) |
| The amount shown for each director is the prorated cost of travel accident insurance covering death, dismemberment, |
The non-employee directors are not entitled to any additional payments or benefits as a result of leaving the Board or death except as described above. The non-employee directors are not entitled to any payments or benefits resulting from a change in control of the Corporation.
DIRECTOR AND EXECUTIVE OFFICER STOCK OWNERSHIP
These tables show the number of ExxonMobil common stock shares each executive named in the “Summary Compensation Table” on page 3335 and each non-employee director or director nominee owned on February 29, 200828, 2009 (or at retirement, if earlier). In these tables, ownership means the right to direct the voting or the sale of shares, even if those rights are shared with someone else. None of these individuals owns more than 0.020.03 percent of the outstanding shares.
| Named Executive Officer | Shares Owned | Shares Covered by Exercisable Options | Shares Owned | Shares Covered by Exercisable Options | ||||||
R.W. Tillerson | 929,149 | (1) | 327,307 | 1,131,520 | (1) | 327,307 | ||||
D.D. Humphreys | 433,346 | (2) | 195,097 | 518,127 | (2) | 175,097 | ||||
S.R. McGill | 909,833 | (3) | 345,097 | |||||||
H.R. Cramer | 671,613 | 458,000 | ||||||||
C.W. Matthews | 525,742 | 110,000 | ||||||||
S.D. Pryor | 712,421 | (3) | 508,000 | |||||||
J.S. Simon | 826,283 | (4) | 470,000 | 833,685 | (4) | 462,705 | ||||
H.R. Cramer | 607,492 | 529,964 | ||||||||
M.E. Foster | 496,169 | (5) | 215,097 | 496,673 | (5) | 215,097 | ||||
P.E. Sullivan | 432,973 | (6) | 309,943 | |||||||
| (1) | Includes |
| (2) | Includes |
| (3) | Includes |
| (4) | Includes 11,177 shares jointly owned with spouse. |
| (5) | Includes |
| Non-Employee Director/Nominee | Shares Owned | ||
M.J. Boskin | |||
L.R. Faulkner | |||
K.C. Frazier | 0 | ||
W.W. George | (1) | ||
J.R. Houghton | (2) | ||
| (3) | ||
| (4) | ||
| |||
| |||
S.J. Palmisano | |||
S.S Reinemund | |||
W.V. Shipley | |||
E.E. Whitacre, Jr. |
| (1) | Includes 10,000 shares held as co-trustee of family foundation. |
| (2) | Includes 5,000 shares owned by spouse. |
| (3) | Includes |
| Includes 18,000 shares held as co-trustee of family trusts. |
| Includes |
On February 29, 2008,28, 2009, ExxonMobil’s incumbent directors and executive officers (27 people) together owned 6,876,8916,979,421 shares of ExxonMobil stock and 3,577,3502,401,119 shares covered by exercisable options, representing about 0.200.19 percent of the outstanding shares.
Section 16(a) Beneficial Ownership Reporting Compliance
The Compensation Committee of the Board of Directors has reviewed and discussed the “Compensation Discussion and Analysis” for 20072008 with management of the Corporation. Based on that review and discussion, we recommended to the Board that the “Compensation Discussion and Analysis” be included in the Corporation’s proxy statement for the 20082009 annual meeting of shareholders, and also incorporated by reference in the Corporation’sAnnual Report on Form 10-K for the year ended December 31, 2007.2008.
| William | ||
| Samuel J. Palmisano | ||
| Reatha Clark King | Edward E. Whitacre, Jr. |
COMPENSATION DISCUSSION AND ANALYSIS
The Compensation Discussion and Analysis and Executive Compensation Tables are organized as follows:
Overview
Providing energy to meet the world’s demands is a complex business. We meet this challenge by taking a long-term view rather than reacting to short-term business cycles. The compensation program of ExxonMobil aligns with and supports the long-term business fundamentals and core business strategies as outlined below.below and illustrated in the model on page 23.
| Ÿ | Long investment horizons; |
| Ÿ |
|
| Ÿ | Worldwide |
| Ÿ | Commodity-based, cyclical |
| Ÿ | Long-term growth in shareholder value; |
| Ÿ | Disciplined, selective, and long-term focus in making investments; |
| Ÿ | Operational excellence; and, |
| Ÿ | Industry-leading returns on capital and superior cash flow. |
Key Elements of the Compensation Program
The key elements of our compensation program and staffing objectives that support thesethe business fundamentals and strategies are:
| Ÿ | Long-termcareer orientation with high individual performance standards (see |
| Ÿ | Basesalary that rewards individual experience and performance (see page |
| Ÿ | Annualbonus grants based on business performance, as well as individual experience and performance (see pages |
| Ÿ | Payment of a large portion of executive compensation in the form ofequity with long mandatory holding periodsthat extend beyond retirement (see pages |
| Ÿ | Retirement benefits (pension and savings plans) that provide for financial security after employment (see |
Other Supporting Compensation and Staffing PrinciplesPractices
| Ÿ | Executives are “at-will” employees of the Company. Theydo not have employment contracts, |
| Ÿ | A strong program ofmanagement development and succession planning is in place to reinforce a career orientation and provide continuity of |
| Ÿ | Inappropriate risk-taking is discouraged by requiring senior executives to hold a substantial portion of their equity incentive award for their entire careerand beyond retirement. |
| Ÿ | All U.S. executives, including the CEO, the other Named Executive Officers, and about 1,200 other U.S. executives, participate incommon programs (the same salary, incentive and retirement programs). Within these programs, the compensation of executives is differentiated based on |
| Ÿ | No tax assistance is provided by the Company on any elements of executive officer compensation or perquisites other than relocation. The relocation policy is a broad-based program that applies to all transferred U.S. professional and executive employees. |
| Ÿ | Substantial amounts of executive compensation are atrisk of forfeiture in case of detrimental activity, unapproved early termination, or material negative restatement of financial or operating results. |
| Ÿ | The Companydoes not reprice equity incentive awards. The utilization of restricted stock instead of stock options and the determination of annual grants on a share-denominated versus price basis help reinforce this practice. |
| Ÿ | Equity compensation is not included in pension calculations. |
Business Performance and Basis for Compensation Decisions
| Ÿ | Compensation decisions are based on the results achieved in the following areas over multiple year periods: |
| – | Total shareholder return; |
| – | Net income; |
| – | Return on capital employed; |
| – | Cash returned to shareholders; |
| – | Safety, health, and environmental performance; |
| – | Operating performance of the Upstream, Downstream, and Chemical segments; |
| – | Business controls; and, |
| – |
|
| Ÿ | Thedecision-making process with respect to compensation requires judgment, taking into account business and individual performance and responsibility.Quantitative targets or formulas are not used to assess individual performance or determine the amount of compensation. The Compensation Committee assesses the results described above against a broad range of goals and objectives and takes into consideration multiple external factors that influence these results. |
| Ÿ | The disclosure regulations result in a roster of Named Executive Officers different from the most senior management team leading the Company, which is referred to as the Management Committee. |
| Ÿ | The Management Committee comprises the following: |
| – | Chairman and |
| – | Senior Vice Presidents |
| – | D.D. Humphreys; |
| – | M.W. Albers, |
| – | M.J. Dolan, who replaced J.S. Simon upon his retirement in 2008; and, |
| – | A.P. Swiger, effective April 2009. |
| Ÿ | All members of the Management Committee are shown as Named Executive Officers except for |
|
| Ÿ | Although each member of the Management Committee is responsible for specific business activities, together they share responsibility for the performance of the Company. |
People and Business Strategies Model
The following summary illustrates how the compensation and executive development strategies support and integrate with ExxonMobil’s business model. This integrated approach supports long-termgrowth in shareholder value.
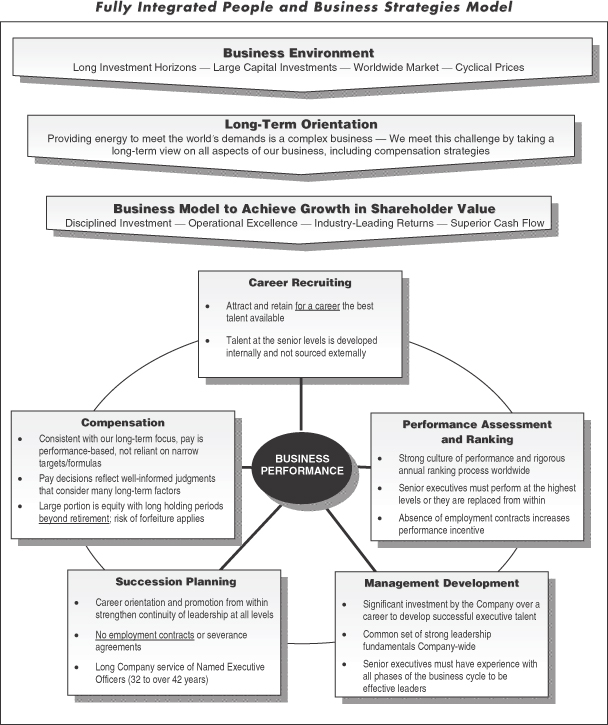
Key Elements of the Compensation Program
| Ÿ | It is our objective to attract and retain for a career the best talent available. |
| Ÿ | It takes a long period of time and a significant investment to develop the experienced executive talent necessary to succeed in the oil and gas business; senior executives must have experience with all phases of the business cycle to be effective leaders. |
| Ÿ | Career orientation among a dedicated and highly skilled workforce, combined with the highest performance standards, contributes to the Company’s leadership in the industry and serves the interests of shareholders in the long term. |
| Ÿ | The long Company service of executive officers reflects this strategy at all levels of the organization. |
| – | The Named Executive Officers have career service ranging from |
| – | The |
| Ÿ | Consistent with our long-term career orientation, high-performing executives typically earn substantially higher levels of compensation in the final years of their careers than in the earlier years. |
| – | This pay practice reinforces the importance of a long-term focus in making decisions that are key to business success. |
| – | Because the compensation program emphasizes individual experience and long-term performance, executives holding similar positions may receive substantially different levels of compensation. |
| Ÿ | Salaries provide executives with a base level of income. |
| Ÿ | The level of annual salary is based on the executive’s responsibility, performance assessment, and career experience. |
| Ÿ | Salary decisions directly affect the level of retirement benefits since salary is included in retirement-benefit formulas. The level of retirement benefits is, therefore, performance-based like |
| Ÿ | The annual bonus program is highly variable depending on annual financial and operating results. |
| Ÿ | The size of the annual bonus pool is based on the annual net income of the Company and other business performance factors as described |
| Ÿ | In setting the size of the annual bonus pool and individual executive awards, the Compensation Committee: |
| – | Secures input from the Chairman on the performance of the Company and from the Compensation Committee’s external consultant regarding compensation trends across industries. |
| – | Uses judgment to |
| Ÿ | The annual bonus program incorporates unique elements to further reinforce retention and recognize performance. Awards under this program are generally delivered as: |

|
|
|
|
|
| Ÿ | Earnings Bonus Units are cash awards that are tied to future cumulative earnings per share. Earnings Bonus Units pay out when a specified level of cumulative earnings per share is achieved or within three years. |
| – | For bonus awards granted in |
| – | If cumulative earnings per share do not reach |
| – | The intent of the earnings per share trigger is to tie the timing of the bonus payment |
| – | Prior to payment, the delayed portion of a bonus may be forfeited if the executive leaves the Company before the standard retirement age, or engages in activity that is detrimental to the Company. |
| – | Cash and Earnings Bonus Unit payments are subject torecoupment in the event of material negative restatement of the Corporation’s reported financial or operating results. |
| Ÿ | The |
| Ÿ | Equity compensation accounts for a substantial portion of total compensation to align the personal financial interests of executives with the long-term interests of shareholders. |
| Ÿ | It is the objective to grant 50 to 70 percent of a senior executive’s total compensation in the form of restricted stock as measured by grant date fair market value, as described beginning on page |
Rationale
| Ÿ | Given the long-term orientation of our business, granting equity in the form of restricted stock with long vesting provisions keeps executives focused on the fundamental premise that decisions made currently affect the performance of the Corporation and Company stock many years into the future. |
| Ÿ | This practice supports a risk/reward profile that reinforces a long-term view, which is fundamental to the |
| Ÿ | Restricted stock removes employee discretion on the sale of Company-granted stock holdings and reinforces the retention objectives of the compensation program. |
Restriction Periods
| Ÿ | The |
| – | 50 percent of each grant is restricted for five years; and, |
| – | The balance is restricted for 10 years or until retirement,whichever is later. |
| Ÿ | The long restriction |
|
|
| Ÿ | For the most senior executives, more than half of the total amount of restricted stockmay not be sold or transferred until after the executive |
| Ÿ | The restricted period for stock awards is not subject to acceleration, except in the case of death. |
Forfeiture Risk and Hedging Policy
| Ÿ | Restricted stock is subject to forfeiture if an executive: |
| – | Leaves the Company before standard retirement time (defined as age 65 for U.S. employees). In the event of early retirement prior to the age of 65 (i.e., age 55 to 64), the Compensation Committee must approve the retention of awards by an executive officer. |
| – | Engages in activity that is detrimental to the Company, even if such activity occurs or is discovered after retirement. |
| Ÿ | Company policy prohibits all employees, including executives, from entering into put or call options |
Share Utilization
| Ÿ | The Compensation Committee establishes a ceiling each year for annual stock awards. The overall number of shares granted in the restricted stock program in |
| Ÿ | The Company has a |
Prior Stock Programs
| Ÿ | All equity awards granted since 2003 are granted under the Corporation’s 2003 Incentive Program. All equity-based awards (including stock options and restricted stock) granted prior to 2003 that remain outstanding were granted under the Corporation’s 1993 Incentive Program (other than awards granted by Mobil Corporation prior to the merger). No further grants can be made under the 1993 Incentive Program. |
| Ÿ | Prior to 2002, ExxonMobil granted Career Shares to the Company’s most senior executives. |
| – | Career Shares |
| – | The Corporation ceased granting Career Shares in 2002 when the Corporation began granting restricted stock to the broader executive population in lieu of stock options. |
| – | Restricted stock and long mandatory holding periods achieve the same objectives as Career Shares and therefore it is unnecessary to grant both Career Shares and the current form of restricted stock. |
| – | Career Shares could be granted again in the future under the Corporation’s 2003 Incentive Program, but there are no current plans to make such grants. |
| Ÿ | Before the merger, Mobil Corporation granted retention awards under the former Mobil Corporation Management Retention Plan. Retention awards are stock units that settle in cash in a single lump sum |
payment as soon as practicable after retirement (taking into account the required six-month delay in payment required under the American Jobs Creation Act of 2004). Messrs. Cramer and Pryor have outstanding retention awards. |
Stock Ownership
| Ÿ | The table below shows |
| ||
| ||
| ||
| ||
| ||
| ||
|
|
| Name | Dollar Value of Stock Ownership as a Multiple of Salary | Percent of Shares Restricted | ||
R.W. Tillerson | 48 | 89% | ||
D.D. Humphreys | 45 | 84% | ||
H.R. Cramer | 64 | 69% | ||
C.W. Matthews | 49 | 72% | ||
S.D. Pryor | 61 | 68% | ||
All Other Executive Officers (average) | 35 | 74% |
Common Programs
| Ÿ | Senior executives participate in the same tax-qualified pension and savings plans as most other U.S. employees. Senior executives also participate in the same nonqualified defined benefit and defined contribution plans as other U.S. executives. |
| Ÿ | A key principle on which the pension and savings programs are based is commonality of design for all employees, except where the American Jobs Creation Act of 2004 requires delayed timing of nonqualified plan distributions for higher-level executives. The same principle of commonality applies to the Company health care benefits (see page |
Pension Plans
| Ÿ | The tax-qualified and nonqualified pension plans, described in more detail beginning on page |
| Ÿ | Pay for |
| Ÿ | Bonus includes the amounts that are paid at grant and the amounts delayed by the Company, as described beginning on page |
| Ÿ | The portion of annual bonus subject to delayed payment is not intended to be at risk and therefore is included for pension purposes in the year of grant rather than the year of payment, as described on page |
| Ÿ | Pension benefits are paid upon retirement as follows: |
| – | Qualified pension plan benefits are payable, at the election of the employee, in a lump sum or in one of various forms of annuity payments. |
| – | Nonqualified pension planbenefits are paid in the form of an equivalent lump sum six months after retirement. |
Qualified Savings Plan
| Ÿ | The qualified savings plan described on page |
| Ÿ | To receive the Company-matching contribution, employees must contribute a minimum of 6 percent of salary. |
| Ÿ | Qualified benefits are payable in a single lump sum or in partial withdrawals at any time after retirement. |
| Ÿ | The Code generally requires distributions to commence after the employee has attained age 70-1/2. |
Nonqualified Savings Plan
| Ÿ | The nonqualified savings plan described on pages |
|
| Ÿ | The nonqualified savings plan balance is paid in a single lump sum six months after retirement. |
Basis of Compensation Decision-Making ProcessCommittee Decisions
The Committee sets the compensation for the Named Executive Officers and certain other senior executives. The following describes the basis on which the Committee made decisions in 2008.
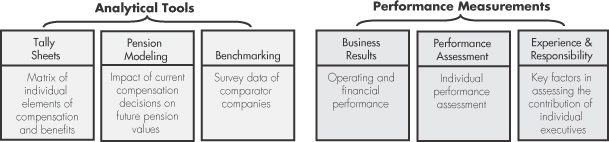
The Compensation Committee used the analytical tools described below to facilitate the compensation decisions made in 2007.
| Ÿ | A tally sheet is a matrix used by the Compensation Committee that shows the individual elements of compensation and benefits for each Named Executive Officer. The total of all compensation and benefit plan elements is included to reflect the full employment costs for each Named Executive Officer. |
| Ÿ | For tally sheet purposes, the Compensation Committee values restricted stock based on fair market value at the date of grant, which equals the number of shares multiplied by the grant price. This is different from the restricted stock values in the “Summary Compensation Table,” which, as required by current disclosure rules, are based on the expensing of outstanding restricted stock under Statement of Financial Accounting Standards No. 123, as revised (FAS 123R). |
| Ÿ | Tally sheets were used for the following principal purposes: |
| – | To understand how decisions on each individual element of compensation |
| – | To gauge total compensation for each senior executive against publicly available data for comparable positions at comparator companies; and, |
| – | To confirm that equity compensation represents a substantial portion of each senior executive’s total compensation. |
| Ÿ | A pension modeling tool was used to determine how current compensation decisions would affect pension values upon retirement. |
| Ÿ |
|
|
|
Comparator Companies
| Ÿ | Comparator Companies |
| – | The following criteria for selecting comparator companies are consistently applied every |
U.S. companies; |
International operations; |
Large scope and complexity; |
Capital intensive; and, |
Proven sustainability/permanence. |
| – | The |
Altria Group AT&T Boeing Chevron | Citigroup ConocoPhillips
General Electric Hewlett-Packard |
IBM Johnson & Johnson | Pfizer Procter & Gamble | United Technologies Verizon Communications |
| – | In the |
Principles
| Ÿ | Principles |
| – | Consistent with the Compensation Committee’s practice of using well-informed judgment rather than formulas to determine executive compensation, the Committee does not target any particular percentile among comparator companies at which to align compensation. |
| – | When the Committee cross-checks compensation levels against comparator companies, the focus is on a broader and more flexible orientation, generally a range around the median of comparator company compensation, which provides the ability to: |
Better respond to changing business conditions; |
Manage salaries based on a career orientation; |
Minimize the potential for automatic ratcheting-up of |
Differentiate |
| – | This benchmarking principle applies to salaries and the annual incentive program that includes bonus awards and stock grants. |
| – | For the purpose of its analysis, the Compensation Committee does not adjust for differences in the types or nature of businesses. Consideration is given, however, to the differences in size, scope, and complexity among ExxonMobil and the comparator companies. This is one of |
| – | The Compensation Committee uses an independent consultant to assist in this analysis as described in the Corporate Governance section beginning on |
Decisions made by the Compensation Committee in 2008 were based on the Company’s operating and financial performance, as well as individual performance, experience and level of responsibility as described below.
The operating and financial performance measurements listed below and the Company’s continued maintenance of sound business controls and a strong corporate governance environment formed the basis for the salary and incentive award decisions made by the Committee in 2008. The Committee considered the results in the aggregate and over multiple years, in recognition of the long-term nature of our business.
| Ÿ | Record net income of $45.2 billion. Five-year annual average of $37.4 billion. |
| Ÿ | Total shareholder return was a negative 13.2 percent versus the S&P 500 of negative 37.0 percent. Ten-year annual average of 10.4 percent. |
| Ÿ | $8.1 billion distributed to shareholders as dividends in 2008. $62.5 billion in dividends distributed to shareholders since the beginning of 2000. Dividend payments per share increased for the 26th consecutive year. |
| Ÿ | $32 billion distributed to shareholders through the share purchase program in 2008 and $125 billion since the beginning of 2000. |
| Ÿ | Strong results in the areas of safety, health, and environment. Workforce safety continues to lead the industry. |
| Ÿ | Industry-leading return on average capital employed of 34.2 percent, with a five-year average of 30.7 percent. |
Performance Assessment Process
| Ÿ | The above business results form the context in which the Committee assesses the individual performance of each senior executive, taking into account experience and level of responsibility. |
| Ÿ | During the annual executive development review with the Board of Directors in October of each year, the CEO reviews the performance of the Management Committee and all officers in achieving results in line with the long-term business strategies (see page 21). |
| Ÿ | The same long-term business strategies and results are key elements in the assessment of the CEO’s performance by the Compensation Committee. |
| Ÿ | The performance of all officers is also assessed by the Board of Directors throughout the year during specific business reviews and Board committee meetings that provide reports on strategy development; operating and financial results; safety, health, and environmental results; business controls; and other areas pertinent to the general performance of the Company. |
| Ÿ | The Committee does not use quantitative targets or formulas to assess executive performance or determine compensation. The Compensation Committee does not assign weights to the factors considered. Formula-based performance assessments and compensation typically require emphasis on two or three business metrics. For the Company to be an industry leader and effectively manage |
the technical complexity and global scope of ExxonMobil, the most senior executives must advance multiple strategies and objectives in parallel, versus emphasizing one or two at the expense of others that require equal attention. |
| Ÿ | An executive’s performance must be high in all key performance areas for the executive to receive an overall superior evaluation. Outstanding performance in one area will not cancel out poor performance in another. For example: |
| – | A problem in safety, health, or environmental performance in a business unit for which the executive is responsible could result in an executive’s incentive award being reduced even though the executive’s performance against financial and other criteria was superior. |
| – | A violation of the Company’s code of business conduct could result in elimination of an executive’s incentive award for the year, as well as termination of employment and/or cancelation of all previously granted awards that have not yet vested or been paid. |
| Ÿ | The Management Committee and all other officers are expected to perform at the highest level or they are replaced. If it is determined that another executive is ready and would make a stronger contribution than one of the current officers, a replacement plan is implemented. |
| Ÿ | The fact that executivesdo not have employment contracts, severance agreements, or change-in-control arrangements eliminates any real or perceived “safety net” with respect to job security. This increases the risk and consequences of performance that does not meet the highest standards. |
Individual Experience and Responsibility
Experience and assigned responsibilities are factors in assessing the contribution of individual executives. The current responsibilities, tenure in the current job, and recent past experience of each Named Executive Officer are described below. Refer to page 22 for information on the leadership structure of the Company.
| Ÿ | Management Committee |
| – | Mr. Tillerson was a Senior Vice President before becoming President and a member of the Board in 2004, and Chairman of the Board and CEO in 2006. |
| – | Mr. Humphreys was Vice President and Controller, and then Vice President and Treasurer before becoming Senior Vice President and Treasurer in 2006. |
| – | Mr. Simon, who retired in 2008, was President of ExxonMobil Refining & Supply Company before becoming Senior Vice President in 2004 and a member of the Board in 2006. |
| Ÿ | Other Named Executive Officers |
| – | Mr. Cramer has been President of ExxonMobil Fuels Marketing Company since 1999. |
| – | Mr. Matthews has been Vice President and General Counsel since 1995. |
| – | Mr. Pryor was President of ExxonMobil Refining & Supply Company since 2004 before becoming President of ExxonMobil Chemical Company in 2008. |
| – | Mr. Foster, who retired in 2008, was President of ExxonMobil Development Company before becoming President of ExxonMobil Production Company in 2004. |
As discussed on page 24, the career service for Named Executive Officers ranges from 32 to over 42 years.
Pay Awarded to Named Executive Officers
| Ÿ | Within the context of the compensation program structure and performance assessment processes described above, the Compensation Committee aligned the value of 2008 incentive awards and 2009 salary adjustments with the: |
| – | Performance of the Company; |
| – | Individual performance; |
| – | Long-term strategic plan of the business; and, |
| – | Annual compensation of comparator companies. |
| Ÿ | The Committee’s decisions reflect judgment taking all factors into consideration, rather than application of formulas or targets. The Committee approved the individual elements of compensation and the total compensation as shown in the tables beginning on page 35. |
CEO
| Ÿ | The higher level of pay for Mr. Tillerson, CEO, versus the other Named Executive Officers reflects his greater level of responsibility, including the ultimate responsibility for the performance of the Corporation and oversight of the other senior executives. |
Other Named Executive Officers
| Ÿ | The higher level of compensation for Mr. Humphreys, versus the active other Named Executive Officers, reflects his greater level of responsibility as Senior Vice President and Treasurer and tenure as a member of the Management Committee. |
| Ÿ | The compensation of Messrs. Cramer and Pryor is lower than that of the CEO and Mr. Humphreys based on combined salary, bonus, and the annual stock grant (calculated using the fair market value on date of grant). This occurs because Messrs. Cramer and Pryor report to designated members of the Management Committee (CEO and Senior Vice Presidents). Messrs. Humphreys and Matthews report to the CEO. |
| Ÿ | Messrs. Simon and Foster are included as Named Executive Officers due to the full expensing of their prior stock grants still outstanding in 2008, resulting from their retirements, as required by FAS 123R. They did not receive a bonus or restricted stock grant in 2008. |
Compensation Allocation
| Ÿ | To achieve alignment with the interests of shareholders, it is the objective that 50 to 70 percent of annual total remuneration be in the form of stock with long holding periods as described on page 25 (based on grant date fair value as shown in the “Grants of Plan-Based Awards” table). |
| Ÿ | To further tie compensation to the performance of the business, the objective is to have about 15 to 20 percent of annual total remuneration in the form of variable annual bonus awards, which are described beginning on page 24. |
| Ÿ | Salary represents less than 10 percent of annual total remuneration, with pension accruals and other forms of compensation comprising the remainder. |
| Ÿ | Whether an executive’s total compensation is near, substantially below, or substantially above the comparator group median is a qualitative factor the Compensation Committee considers along with experience, level of responsibility, and performance (see page 29). |
| Ÿ | The allocation of compensation in 2008 for the CEO and the average for the other Named Executive Officers is illustrated in the chart below, excluding Messrs. Simon and Foster. |
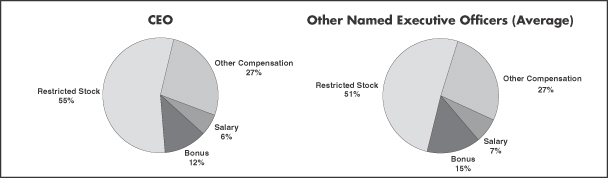
Salary
| Ÿ | The change in salary for the active Named Executive Officers from the prior year, as shown in the “Summary Compensation Table,” primarily reflects adjustments to the competitive position of the base salary program for U.S. executives, taking into account individual experience and level of responsibility. |
Bonus
| Ÿ | The change in bonus for the active Named Executive Officers from the prior year, as shown in the “Summary Compensation Table,” reflects the Company’s strong business results compared to 2007 and takes into account individual experience and level of responsibility. |
Restricted Stock
| Ÿ | The increase in the number of shares granted to Messrs. Tillerson and Humphreys reflects the Corporation’s strong earnings and cash flow performance, safety record, and performance versus industry peers (see “Business Results Considered” on page 30), as well as the additional experience the officers have gained in their positions. |
| Ÿ | The Committee makes grant decisions on a share-denominated basis rather than a price basis. The Committee does not support a practice of offsetting the loss or gain of prior restricted stock grants by the value of current year grants. This practice would minimize the risk/reward profile of equity-based awards and undermine the long-term view that executives are expected to adopt. |
| Ÿ | The Corporation also compares the total value of restricted stock grants against the combined value of all forms of long term awards by comparator companies through an annual benchmarking process, and makes adjustments as necessary (see page 29). |
Other Compensation
| Ÿ | This category comprises the change in pension value and earnings on nonqualified deferred compensation and all other compensation as shown in the “Summary Compensation Table” beginning on page 35. |
| Ÿ | The Compensation Committee grants incentive awards to the Company’s senior executives at |
| – | The Board of Directors meeting is scheduled over a year in advance and is held on the last Wednesday of the month (or on Tuesday if the last Wednesday immediately precedes Thanksgiving). |
| – | This firm timing of award grants is reinforced through a decision-making process in which the Corporation does not grant awards by written consent. |
| Ÿ | A committee comprising ExxonMobil’s Chairman and Senior Vice Presidents grants incentive awards to other eligible managerial, professional, and technical employees, within the parameters of the bonus and equity award ceilings approved by the Compensation Committee. The schedule of the November meeting of the Compensation Committee as described above determines when this committee meets to approve the annual incentive grants for employees under its purview. |
| Ÿ | The Company has not granted stock options since 2001. |
| Ÿ | Previously granted stock options that remain outstanding were granted on the same annual schedule described above except for grants in 1999. Due to the fact that the merger closed on November 30 of that year, the regular annual grant meeting date was moved to December 8. Grants to other managerial, professional, and technical employees were made on December 8, and also to additional grantees on April 26, 2000, after employee data for the two companies had been more fully integrated. |
| Ÿ | The exercise price for each stock option grant was the average of the high and low sale prices reported on the NYSE on the date of the grant meeting. |
| Ÿ | U.S. income tax law limits the amount ExxonMobil can deduct for compensation paid to the CEO and the other three most highly paid executives other than the Principal Financial Officer (PFO). Performance-based compensation that meets Internal Revenue Service requirements is not subject to this limit. |
| – | The short term awards and restricted stock grants described above are designed to meet these requirements so that ExxonMobil can continue to deduct the related expenses. The shareholders have approved the material terms of performance goals for awards to the senior executives. These material terms limit short term and long term awards to each of these executives to 0.2 and 0.5 percent, respectively, of income from continuing operations. |
These terms have been established to meet tax regulations and do not represent performance targets for the affected executives. |
Actual award levels have been significantly less based on the factors and judgments described in this report. |
| – | Salaries for senior executives may be set at levels that exceed the U.S. income tax law limitation on deductibility. The primary drivers for determining the amount and form of executive compensation are the retention and motivation of superior executive talent rather than the Internal Revenue Code. |
| Ÿ | In 2005 the Compensation Committee eliminated the ability of executives to defer payment of incentive awards. No element of compensation for executives can be deferred prior to retirement. |
| Ÿ | Tax assistance is not provided by the Company for either the short term or long term incentive awards discussed above. |
| Ÿ | All nonqualified pension and other benefits have been modified to be in full compliance with the American Jobs Creation Act of 2004, which imposes tax penalties unless the form and timing of distributions are fixed to eliminate executive and company |
2007 Named Executive Officer Compensation
The indicators that formed the basis for the salary and incentive awards in 2007 were:
|
|
|
|
|
|
|
|
Performance Assessment Process
|
|
|
|
|
|
|
|
|
|
|
Individual Experience and Responsibility
Experience and assigned responsibilities are factors in assessing the contribution of individual executives. The current responsibilities, tenure in the current job, and recent past experience of each Named Executive Officer are described below. Refer to page 21 for information on the leadership structure of the Company.
Management Committee
|
|
|
|
Other Named Executive Officers
|
|
|
As discussed on page 21, the career service for Named Executive Officers ranges from 31 to over 42 years.
|
|
|
|
|
|
CEO
|
Senior Vice Presidents
|
|
Other Named Executive Officers
|
|
Compensation Allocation
|
|
|
|
|
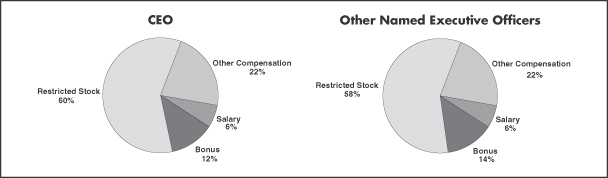
Salary/Bonus
|
Restricted Stock
|
|
|
|
Recoupment
|
|
|
|
Life Insurance
|
Tax Assistance
|
Savings Plan
|
|
|
Retention Plan (Former Mobil Corporation Plan)
|
Summary Compensation Table for 20072008
Name and Principal Position | Year | Salary ($) | Bonus ($) | Stock Awards ($)* | Option Awards ($) | Non- Equity sation ($) | Change in Pension Value and Nonqualified Deferred Compen- sation Earnings ($) | All Other Compen- sation ($) | Total ($) | |||||||||
R.W. Tillerson Chairman and CEO | 2007 2006 | 1,750,000 1,500,000 | 3,360,000 2,800,000 | 5,675,362 4,159,713 | 0 0 | 0 0 | 5,511,588 4,067,544 | 429,792 482,238 | 16,726,742 13,009,495 | |||||||||
D.D. Humphreys PFO; Senior Vice President | 2007 2006 | 830,000 750,000 | 1,859,000 1,750,000 | 2,421,168 1,768,252 | 0 0 | 0 0 | 3,919,806 2,784,795 | 86,689 97,331 | 9,116,663 7,150,378 | |||||||||
S.R. McGill Senior Vice President (Retired 8/1/07) | 2007 2006 | 714,899 935,000 | 1,260,000 2,150,000 | 18,233,505 3,976,673 | 0 0 | 0 0 | 743,736 2,037,297 | 112,771 115,846 | 21,064,911 9,214,816 | |||||||||
J.S. Simon Senior Vice President and Director | 2007 2006 | 995,000 935,000 | 2,150,000 2,150,000 | 9,168,388 3,284,506 | 0 0 | 0 0 | 2,585,221 2,088,907 | 135,133 121,735 | 15,033,742 8,580,148 | |||||||||
H.R. Cramer Vice President; President, ExxonMobil Fuels Marketing Company | 2007 2006 | 807,917 772,917 | 1,586,000 1,586,176 | 3,645,262 2,921,188 | 0 0 | 0 0 | 2,294,584 1,833,188 | 86,202 93,148 | 8,419,965 7,206,617 | |||||||||
M.E. Foster Vice President; President, ExxonMobil Production Company | 2007 | 803,750 | 1,859,000 | 7,805,893 | 0 | 0 | 2,930,181 | 116,389 | 13,515,213 | |||||||||
P.E. Sullivan Vice President; General Tax Counsel (Retired 5/24/07) | 2007 | 252,754 | 0 | 9,049,979 | 0 | 0 | 554,607 | 59,518 | 9,916,858 |
Name and Principal Position | Year | Salary ($) | Bonus ($) | Stock Awards ($)* | Option Awards ($) | Non- Equity sation ($) | Change in Pension Value and Nonqualified Deferred Compen- sation Earnings ($) | All Other Compen- sation ($) | Total ($) | |||||||||
R.W. Tillerson Chairman and CEO | 2008 2007 2006 | 1,870,000 1,750,000 1,500,000 | 4,000,000 3,360,000 2,800,000 | 7,807,523 5,675,362 4,159,713 | 0 0 0 | 0 0 0 | 8,290,253 5,511,588 4,067,544 | 446,826 429,792 482,238 | 22,414,602 16,726,742 13,009,495 | |||||||||
D.D. Humphreys PFO; Senior Vice President | 2008 2007 2006 | 910,000 830,000 750,000 | 2,364,000 1,859,000 1,750,000 | 3,895,851 2,421,168 1,768,252 | 0 0 0 | 0 0 0 | 4,599,191 3,919,806 2,784,795 | 108,989 86,689 97,331 | 11,878,031 9,116,663 7,150,378 | |||||||||
H.R. Cramer Vice President; President, ExxonMobil Fuels Marketing Company | 2008 2007 2006 | 843,333 807,917 772,917 | 1,744,598 1,586,000 1,586,176 | 3,383,296 3,645,262 2,921,188 | 0 0 0 | 0 0 0 | 3,215,127 2,294,584 1,833,188 | 87,522 86,202 93,148 | 9,273,876 8,419,965 7,206,617 | |||||||||
C.W. Matthews Vice President; General Counsel | 2008 | 855,000 | 1,477,305 | 5,490,643 | 0 | 0 | 1,781,214 | 96,065 | 9,700,227 | |||||||||
S.D. Pryor Vice President; President, ExxonMobil Chemical Company | 2008 | 905,000 | 1,744,598 | 3,668,776 | 0 | 0 | 3,571,656 | 311,614 | 10,201,644 | |||||||||
RETIRED | ||||||||||||||||||
J.S. Simon Senior Vice President and Director (Retired 6/1/2008) | 2008 2007 2006 | 593,337 995,000 935,000 | 0 2,150,000 2,150,000 | 18,366,191 9,168,388 3,284,506 | 0 0 0 | 0 0 0 | 714,029 2,585,221 2,088,907 | 103,747 135,133 121,735 | 19,777,304 15,033,742 8,580,148 | |||||||||
M.E. Foster Vice President; President, ExxonMobil Production Company (Retired 4/1/2008) | 2008 2007 | 314,233 803,750 | 0 1,859,000 | 12,113,088 7,805,893 | 0 0 | 0 0 | 554,968 2,930,181 | 76,845 116,389 | 13,059,134 13,515,213 | |||||||||
| * | In accordance with disclosure regulations, the valuation of “Stock Awards” in this table represents the compensation cost of awards recognized for financial statement purposes |
As described in more detail under “Stock Awards” below, the stock award values shown in 20072008 for Messrs. McGillSimon and SullivanFoster reflect the recognition of expense for outstanding awards triggered by their retirements.This is not a severance payment or a new award. Of the underlying stock awards for Messrs. McGillSimon and Sullivan,Foster, more than 8793 and 8996 percent, respectively, remain restricted from transfer and subject to forfeiture for a number of years.
The stock award valuesvalue shown in 20072008 for Messrs. Simon and Foster includeMr. Matthews includes the effect of using a shorter amortization schedule since they arehe is nearing standard retirement age.
Employment Arrangements
ExxonMobil’s Compensation Committee believes senior executives should be “at-will”“at will” employees of the Corporation. Accordingly the CEO and other executive officers, including the other officers named in these tables,do not have employment contracts, severance agreements, or change-in-control arrangements with the Company.
Salary
| Ÿ | Effective January 1, |
| Ÿ | The |
| Ÿ |
|
|
Bonus
| Ÿ | As described in more detail in the “Compensation Discussion and Analysis” (CD&A) |
| Ÿ | Delayed bonus amounts do not earn interest. |
| Ÿ | The bonus and the stock awards described below meet the requirements of Section 162(m) of the Internal Revenue Code for tax deductibility, which is explained in more detail on page |
Stock Awards
| Ÿ | In accordance with disclosure regulations, the valuation of stock awards in this table represents the compensation cost of awards recognized for financial statement purposes |
| Ÿ | The amounts include portions of restricted stock grants in 2002 through |
| – | Awards granted in 2002 through 2005 are amortized over the period of restriction. |
| – | Awards granted after 2005 are amortized over the period of restriction or the time between the grant |
| Ÿ | The |
| Ÿ | If an executive retires in the reportable year, the remaining amortization expense for all outstanding awards is accelerated and recognized in the year of retirement (see the specific discussion regarding Messrs. |
|
| Ÿ | The remaining value of all outstanding Career Shares described on page |
| Ÿ | The amount shown for stock awards also includes the following: |
| – | For |
cost of the awards based on changes in share price is expensed quarterly on a mark-to-market method. The |
| – | For Mr. |
|
| – | For Mr. Foster, the scheduled amortization expense is through his retirement date of April 1, 2008, and reflects the expensing of the unamortized remaining balance of six years’ worth of outstanding awards. Mr. Foster did not receive a 2008 restricted stock award. His Career Shares remained restricted for nine months after retirement, and his restricted stock grants outstanding from 2002 through 2007 will remain restricted for up to nine years and eight months following his retirement. |
| Ÿ |
|
| Ÿ | Dividends on stock awards are not shown in the table because those amounts are reflected in the grant date fair value reported in the “Grants of Plan-Based Awards” table. |
Change in Pension Value and Nonqualified Deferred Compensation Earnings
The following table breaks down the 20072008 amounts shown in this column in the “Summary Compensation Table.”
| Name | Change in Pension Value ($) | Nonqualified Deferred ($) | Total ($) | Change in Pension Value ($) | Nonqualified Deferred ($) | Total ($) | ||||||
R.W. Tillerson | 5,503,814 | 7,774 | 5,511,588 | 8,290,253 | 0 | 8,290,253 | ||||||
D.D. Humphreys | 3,914,385 | 5,421 | 3,919,806 | 4,599,191 | 0 | 4,599,191 | ||||||
S.R. McGill | 550,994 | 192,742 | 743,736 | |||||||||
H.R. Cramer | 3,215,127 | 0 | 3,215,127 | |||||||||
C.W. Matthews | 1,781,214 | 0 | 1,781,214 | |||||||||
S.D. Pryor | 3,571,656 | 0 | 3,571,656 | |||||||||
J.S. Simon | 2,575,468 | 9,753 | 2,585,221 | 714,029 | 0 | 714,029 | ||||||
H.R. Cramer | 2,273,928 | 20,656 | 2,294,584 | |||||||||
M.E. Foster | 2,921,630 | 8,551 | 2,930,181 | 552,298 | 2,670 | 554,968 | ||||||
P.E. Sullivan | 419,287 | 135,320 | 554,607 | |||||||||
Pension Value
| Ÿ | The change in pension value shown in the table is the increase between year-end |
| Ÿ | For each year end, the data reflects an annuity beginning at age 60 (or current age if over 60) equal to 1.6 percent of the participant’s covered compensation multiplied by year-end service. These values are converted to lump sums using the plan’s applicable factors and then discounted in the case of employees under age 60 to present values based on the time difference between the individual’s age at year-end |
| Ÿ | The lump sum interest rate applied for an employee who worked through the end of |
| Ÿ | The pension accrual shown for the two retired Named Executive Officers reflects their additional months of service in |
| – | For Mr. |
| – | For Mr. |
Nonqualified Deferred Earnings
| Ÿ |
|
| Ÿ | For |
All Other Compensation
The following table breaks down the amounts included in the “All Other Compensation” column of the “Summary Compensation Table.” Note the table has been changed from prior years as follows: removed the column for “Club Memberships” since the Company discontinued reimbursement effective January 1, 2007; and added a new column labeled “Relocation” since a Named Executive Officer had relocation costs in 2008.
| Name | Life Insurance ($) | Savings ($) | Personal ($) | Personal Use of Company | Club Memberships (Discontinued ($) | Financial ($) | Tax Assistance ($) | Total ($) | Life Insurance ($) | Savings ($) | Personal ($) | Personal Use of Company | Relocation ($) | Financial ($) | Tax Assistance ($) | Total ($) | ||||||||||||||||||||||||
Aircraft ($) | Properties ($) | Car ($) | Aircraft ($) | Properties ($) | Car ($) | |||||||||||||||||||||||||||||||||||
R.W. Tillerson | 35,690 | 107,250 | 229,331 | 41,122 | 0 | 0 | 1,157 | 9,150 | 6,092 | 429,792 | 38,390 | 130,900 | 222,985 | 41,980 | 3,271 | 0 | 0 | 9,300 | 0 | 446,826 | ||||||||||||||||||||
D.D. Humphreys | 16,994 | 51,875 | 3,262 | 0 | 0 | 0 | 0 | 9,150 | 5,408 | 86,689 | 28,618 | 63,700 | 3,281 | 0 | 4,090 | 0 | 0 | 9,300 | 0 | 108,989 | ||||||||||||||||||||
S.R. McGill | 52,273 | 36,550 | 2,737 | 0 | 0 | 0 | 931 | 12,400 | 7,880 | 112,771 | ||||||||||||||||||||||||||||||
H.R. Cramer | 17,338 | 59,033 | 1,835 | 0 | 0 | 16 | 0 | 9,300 | 0 | 87,522 | ||||||||||||||||||||||||||||||
C.W. Matthews | 26,915 | 59,850 | 0 | 0 | 0 | 0 | 0 | 9,300 | 0 | 96,065 | ||||||||||||||||||||||||||||||
S.D. Pryor | 18,593 | 63,350 | 810 | 0 | 0 | 528 | 148,275 | 7,500 | 72,558 | 311,614 | ||||||||||||||||||||||||||||||
J.S. Simon | 31,363 | 61,950 | 10,262 | 0 | 17,000 | 0 | 0 | 9,150 | 5,408 | 135,133 | 58,115 | 30,333 | 2,469 | 0 | 430 | 0 | 0 | 12,400 | 0 | 103,747 | ||||||||||||||||||||
H.R. Cramer | 16,615 | 50,725 | 1,823 | 0 | 0 | 0 | 922 | 9,150 | 6,967 | 86,202 | ||||||||||||||||||||||||||||||
M.E. Foster | 25,265 | 50,475 | 7,488 | 0 | 15,000 | 933 | 1,678 | 9,150 | 6,400 | 116,389 | 46,965 | 15,050 | 1,246 | 0 | 0 | 1,184 | 0 | 12,400 | 0 | 76,845 | ||||||||||||||||||||
P.E. Sullivan | 20,275 | 17,415 | 0 | 0 | 0 | 0 | 1,401 | 12,400 | 8,027 | 59,518 | ||||||||||||||||||||||||||||||
Life Insurance
| Ÿ | The Company offers senior executives term life insurance or a Company-paid death benefit. |
| Ÿ | Coverage under either option equals four times base salary until age 65, and a declining multiple thereafter until age 75, at which point the multiple remains at 2.5 times salary. |
| Ÿ | For executives with life insurance coverage, the premium cost in any year depends on overall financial and mortality experience under the group policy. |
| Ÿ | For executives electing the death benefit, there is no cash cost until the executive dies, as benefits are paid directly by the Company. |
| Ÿ | The amount shown is based on Internal Revenue Service tables used to value the term cost of such coverage. This valuation is applied since the actual life insurance premium is a single payment for a |
large group of executives that does not represent the cost of insuring one specific individual and because several of the Named Executive Officers have elected the death benefit, the long-term cost of which is comparable to the insurance. |
| Ÿ | The Company eliminated the executive term life insurance and Company-paid death benefit for all newly eligible executives as of October 1, 2007, and retained it for all current participants, including the Named Executive |
Savings Plan
| Ÿ | The amount shown is the value of Company-matching contributions under ExxonMobil’s tax-qualified defined contribution (401(k)) plan and Company credits under the related nonqualified supplemental plan. |
| Ÿ |
|
The nonqualified supplemental plan provides all affected employees with the |
| Ÿ | The value of the credits to the nonqualified supplemental plan is also disclosed in the “Nonqualified Deferred Compensation” table on page |
Personal Security
| Ÿ | The Company provides security for its employees as appropriate based on an assessment of risk. The assessment includes consideration of the employee’s position and work location. |
| Ÿ | The Company does not consider any such security costs to be personal benefits since these costs arise from the nature of the employee’s employment by the Company; however, the disclosure regulations require certain security costs to be reported as personal benefits. |
| Ÿ | The amounts shown in the table include the following types of security related costs: security systems at executive residences; security services and personnel (at residences and/or during personal travel); car and personal security driver; and Company mobile phones. Costs of security relating to travel for business purposes |
| Ÿ | Cars provided for security reasons and used primarily for commuting are valued based on the annualized cost of the car plus maintenance and fuel. Reported costs for rental cars utilized due to security concerns during personal travel are the actual incremental costs. |
| Ÿ | For security personnel employed by the Company, the cost is the actual incremental cost of expenses incurred by the security personnel. Total salary, wages, and benefits for security personnel are not allocated because the Company already incurs these costs for business purposes. |
| Ÿ | For security contractors, the cost is the actual incremental cost of such contractors associated with the executive’s personal time. |
| Ÿ | For Mr. Tillerson, the amount shown includes $34,060 for car, $57,513 for personal security driver, and $122,182 for residential security. The remainder is for mobile phones and other communications equipment for conducting business in a secure manner. |
Aircraft
| Ÿ | Incremental cost for personal use of the aircraft is based on direct operating costs (fuel, airport fees, incremental pilot costs, etc.) and does not include capital costs of the aircraft since the Company already incurs these capital costs for business purposes. |
| Ÿ | For security reasons, the Board requires the Chairman and CEO to use Company aircraft for both business and personal travel. |
| Ÿ | The Committee considers these costs to be necessary, security-related business expenses rather than perquisites, but per the disclosure regulations we report the incremental cost of aircraft usage for personal travel. |
Properties
| Ÿ | The Company owns or leases various venues for the purpose of business entertainment, including boxes and season tickets to sporting events and recreation and conference retreat properties. When these venues are not otherwise in use for business entertainment, the tickets and properties may be available for use by Company executives and other personnel. |
| Ÿ | The table shows the incremental cost incurred for any personal use of these venues by the Named Executive Officers. |
| Ÿ | Cost for this purpose is based solely on incremental operating costs (catering, transportation, incremental employee or contractor costs, etc.) and does not include annual or capital costs of these venues since the Company already incurs these costs for business purposes. |
Car
| Ÿ | Incremental cost for personal use of company car |
Club Memberships
|
Financial Planning
| Ÿ | The Company provides financial planning services to senior executives, which |
Relocation
| Ÿ | The Company provides relocation assistance for all transferred professionals and executives. All affected employees participate in the Company’s relocation program on the same basis. The amount shown is the relocation costs reimbursed to the executive or paid on behalf of the executive. |
Tax Assistance
| Ÿ | The amount shown is the aggregate amount of payments made on the executive’s behalf by the Corporation during the year for the payment of taxes related to |
Grants of Plan-Based Awards for 20072008
| Name | Grant Date | Estimated Future Under Non-Equity Plan Awards | Estimated Future Under Equity Plan Awards | All Other Stock Awards: Number of Shares of Stock or Units (#) | All Other Option Awards: Number Securities Under- lying Options (#) | Exercise Base of Awards ($/Sh) | Grant Date Fair Value of Stock and Option Awards ($) | Grant Date | Estimated Future Under Non-Equity Plan Awards | Estimated Future Under Equity Plan Awards | All Other Stock Awards: Number of Shares of Stock or Units (#) | All Other Option Awards: Number Securities Under- lying Options (#) | Exercise Base of Awards ($/Sh) | Grant Date Fair Value of Stock and Option Awards ($) | ||||||||||||||||||||||||||||||
Thresh- old ($) | Tar- get ($) | Maxi- mum ($) | Thresh- old (#) | Tar- get (#) | Maxi- mum (#) | Thresh- old ($) | Tar- get ($) | Maxi- mum ($) | Thresh- old (#) | Tar- get (#) | Maxi- mum (#) | |||||||||||||||||||||||||||||||||
R.W. Tillerson | 11/28/2007 | 0 | 0 | 0 | 0 | 0 | 0 | 185,000 | 0 | 0 | 16,120,900 | 11/25/2008 | 0 | 0 | 0 | 0 | 0 | 0 | 225,000 | 0 | 0 | 17,604,000 | ||||||||||||||||||||||
D.D. Humphreys | 11/28/2007 | 0 | 0 | 0 | 0 | 0 | 0 | 90,800 | 0 | 0 | 7,912,312 | 11/25/2008 | 0 | 0 | 0 | 0 | 0 | 0 | 106,400 | 0 | 0 | 8,324,736 | ||||||||||||||||||||||
S.R. McGill | — | 0 | 0 | 0 | 0 | 0 | 0 | 0 | 0 | 0 | 0 | |||||||||||||||||||||||||||||||||
H.R. Cramer | 11/25/2008 | 0 | 0 | 0 | 0 | 0 | 0 | 77,000 | 0 | 0 | 6,024,480 | |||||||||||||||||||||||||||||||||
C.W. Matthews | 11/25/2008 | 0 | 0 | 0 | 0 | 0 | 0 | 64,400 | 0 | 0 | 5,038,656 | |||||||||||||||||||||||||||||||||
S.D. Pryor | 11/25/2008 | 0 | 0 | 0 | 0 | 0 | 0 | 77,000 | 0 | 0 | 6,024,480 | |||||||||||||||||||||||||||||||||
J.S. Simon | 11/28/2007 | 0 | 0 | 0 | 0 | 0 | 0 | 107,000 | 0 | 0 | 9,323,980 | — | 0 | 0 | 0 | 0 | 0 | 0 | 0 | 0 | 0 | 0 | ||||||||||||||||||||||
H.R. Cramer | 11/28/2007 | 0 | 0 | 0 | 0 | 0 | 0 | 77,000 | 0 | 0 | 6,709,780 | |||||||||||||||||||||||||||||||||
M.E. Foster | 11/28/2007 | 0 | 0 | 0 | 0 | 0 | 0 | 90,800 | 0 | 0 | 7,912,312 | — | 0 | 0 | 0 | 0 | 0 | 0 | 0 | 0 | 0 | 0 | ||||||||||||||||||||||
P.E. Sullivan | — | 0 | 0 | 0 | 0 | 0 | 0 | 0 | 0 | 0 | 0 | |||||||||||||||||||||||||||||||||
The awards granted in 20072008 are in the form of restricted stock.
Restrictions and Forfeiture Risk
| Ÿ | These grants are restricted (1) for half the shares, until five years after the grant date; and, (2) for the balance, until 10 years after the grant date or retirement, whichever occurs later. These restricted periods are not subject to acceleration, except upon death, and thus, shares may remain subject to restriction for many years after an executive’s retirement. |
| Ÿ | During the restricted period, the executive receives the same cash dividends as a holder of regular common stock and may vote the shares; however, the executive may not sell or transfer the shares, or use them as collateral. |
| Ÿ | The shares also remain subject to forfeiture during the restricted period in case of an unapproved early termination of employment or in case the executive is found to have engaged in activity that is detrimental to the Company. Detrimental activity may include conduct that violates the Company’s Ethics or Conflicts of Interest policies. |
Grant Date
| Ÿ | The grant date is the same as the date on which the Compensation Committee of the Board met to approve the awards, as described beginning on page |
| Ÿ | Grant date fair value is equal to the number of shares awarded times the grant price, which is deemed to be the average of the high and low sale prices on the NYSE on the grant date (November |
Outstanding Equity Awards at Fiscal Year-End for 20072008
| Name | Option Awards | Stock Awards | ||||||||||||||||
| Number of Securities Underlying Unexercised Options (#) Exercisable | Number of Securities Underlying Unexercised Options (#) Unexercisable | Equity Incentive Plan Awards: Number of Securities Underlying Unexercised Unearned Options (#) | Option Exercise Price ($) | Option Date | Number of Shares or Units of Stock That Have Not Vested (#) | Market Value of | Equity Awards: Rights That | Equity Incentive Awards: Market or Rights That Vested ($) | ||||||||||
R.W. Tillerson | 130,000 | 0 | 0 | 45.21875 | 11/28/2010 | 830,500 | 77,809,545 | 0 | 0 | |||||||||
| 197,307 | 37.12000 | 11/27/2011 | ||||||||||||||||
D.D. Humphreys | 20,000 | 0 | 0 | 41.78125 | 12/07/2009 | 348,900 | 32,688,441 | 0 | 0 | |||||||||
| 87,790 | 45.21875 | 11/28/2010 | ||||||||||||||||
| 87,307 | 37.12000 | 11/27/2011 | ||||||||||||||||
S.R. McGill | 167,790 | 0 | 0 | 45.21875 | 11/28/2010 | 493,350 | 46,221,962 | 0 | 0 | |||||||||
| 177,307 | 37.12000 | 11/27/2011 | ||||||||||||||||
J.S. Simon | 31,842 | 0 | 0 | 36.18750 | 11/24/2008 | 554,150 | 51,918,314 | 0 | 0 | |||||||||
| 120,000 | 41.78125 | 12/07/2009 | ||||||||||||||||
| 170,000 | 45.21875 | 11/28/2010 | ||||||||||||||||
| 180,000 | 37.12000 | 11/27/2011 | ||||||||||||||||
H.R. Cramer | 21,964 | 0 | 0 | 31.70000 | 02/25/2009 | 456,538 | 42,773,081 | 0 | 0 | |||||||||
| 168,000 | 41.78125 | 12/07/2009 | ||||||||||||||||
| 170,000 | 45.21875 | 11/28/2010 | ||||||||||||||||
| 170,000 | 37.12000 | 11/27/2011 | ||||||||||||||||
M.E. Foster | 107,790 | 0 | 0 | 45.21875 | 11/28/2010 | 364,850 | 34,182,797 | 0 | 0 | |||||||||
| 107,307 | 37.12000 | 11/27/2011 | ||||||||||||||||
P.E. Sullivan | 67,238 | 0 | 0 | 36.18750 | 11/24/2008 | 227,200 | 21,286,368 | 0 | 0 | |||||||||
| 67,608 | 41.78125 | 12/07/2009 | ||||||||||||||||
| 87,790 | 45.21875 | 11/28/2010 | ||||||||||||||||
| 87,307 | 37.12000 | 11/27/2011 | ||||||||||||||||
| Name | Option Awards | Stock Awards | ||||||||||||||||
| Number of Securities Underlying Unexercised Options (#) Exercisable | Number of Securities Underlying Unexercised Options (#) Unexercisable | Equity Incentive Plan Awards: Number of Securities Underlying Unexercised Unearned Options (#) | Option Exercise Price ($) | Option Date | Number of Shares or Units of Stock That Have Not Vested (#) | Market Value of | Equity Awards: Rights That | Equity Incentive Awards: Market or Rights That Vested ($) | ||||||||||
R.W. Tillerson | 130,000 | 0 | 0 | 45.21875 | 11/28/2010 | 1,002,000 | 79,989,660 | 0 | 0 | |||||||||
| 197,307 | 37.12000 | 11/27/2011 | ||||||||||||||||
D.D. Humphreys | 87,790 | 0 | 0 | 45.21875 | 11/28/2010 | 436,950 | 34,881,719 | 0 | 0 | |||||||||
| 87,307 | 37.12000 | 11/27/2011 | ||||||||||||||||
H.R. Cramer | 118,000 | 0 | 0 | 41.78125 | 12/07/2009 | 502,188 | 40,089,668 | 0 | 0 | |||||||||
| 170,000 | 45.21875 | 11/28/2010 | ||||||||||||||||
| 170,000 | 37.12000 | 11/27/2011 | ||||||||||||||||
C.W. Matthews | 110,000 | 0 | 0 | 37.12000 | 11/27/2011 | 376,900 | 30,087,927 | 0 | 0 | |||||||||
S.D. Pryor | 11,090 | 0 | 0 | 31.70000 | 02/25/2009 | 491,141 | 39,207,786 | 0 | 0 | |||||||||
| 168,000 | 41.78125 | 12/07/2009 | ||||||||||||||||
| 170,000 | 45.21875 | 11/28/2010 | ||||||||||||||||
| 180,000 | 37.12000 | 11/27/2011 | ||||||||||||||||
J.S. Simon | 117,608 | 0 | 0 | 41.78125 | 12/07/2009 | 517,450 | 41,308,034 | 0 | 0 | |||||||||
| 167,790 | 45.21875 | 11/28/2010 | ||||||||||||||||
| 177,307 | 37.12000 | 11/27/2011 | ||||||||||||||||
M.E. Foster | 107,790 | 0 | 0 | 45.21875 | 11/28/2010 | 344,500 | 27,501,435 | 0 | 0 | |||||||||
| 107,307 | 37.12000 | 11/27/2011 | ||||||||||||||||
Option Awards
| Ÿ | The option awards shown are exercisable and outstanding as of year end. The actual gain on an option exercise, if any, will depend on the market price of ExxonMobil stock at the time of exercise. ExxonMobil has not granted stock options since 2001. |
Stock Awards (Restricted Stock/Units)
| Ÿ | See the narrative accompanying the “Grants of Plan-Based Awards” table as well as the narrative describing Stock Awards in the “Summary Compensation Table” for more information regarding the terms of restricted stock. For |
| Ÿ | The table below shows the dates on which the respective restricted periods for the restricted stock shown in the previous table expire, assuming the awards are not forfeited and the executive is alive when the restrictions lapse. |
| Name | Date Restrictions Lapse / Number of Shares | Date Restrictions Lapse / Number of Shares | ||||||||||||||||||||||||||
| 11/26/2008 | 11/23/2009 | 11/30/2010 | 11/28/2011 | 11/28/2012 | 10 Years or Retirement, Whichever Occurs Later | Retirement* | 11/23/2009 | 11/30/2010 | 11/28/2011 | 11/28/2012 | 11/25/2013 | 10 Years or Retirement, Whichever Occurs Later | Retirement* | |||||||||||||||
R.W. Tillerson | 53,500 | 66,000 | 75,000 | 92,500 | 92,500 | 433,000 | 18,000 | 66,000 | 75,000 | 92,500 | 92,500 | 112,500 | 545,500 | 18,000 | ||||||||||||||
D.D. Humphreys | 18,350 | 24,200 | 28,000 | 40,000 | 45,400 | 172,950 | 20,000 | 24,200 | 28,000 | 40,000 | 45,400 | 53,200 | 226,150 | 20,000 | ||||||||||||||
S.R. McGill | 36,700 | 53,500 | 53,500 | 53,500 | 0 | 232,150 | 64,000 | |||||||||||||||||||||
H.R. Cramer | 38,500 | 38,500 | 38,500 | 38,500 | 38,500 | 255,200 | 54,488 | |||||||||||||||||||||
C.W. Matthews | 27,500 | 30,000 | 32,200 | 32,200 | 32,200 | 194,800 | 28,000 | |||||||||||||||||||||
S.D. Pryor | 38,500 | 38,500 | 38,500 | 38,500 | 38,500 | 260,400 | 38,241 | |||||||||||||||||||||
J.S. Simon | 36,700 | 45,400 | 53,500 | 53,500 | 53,500 | 277,550 | 34,000 | 45,400 | 53,500 | 53,500 | 53,500 | 0 | 277,550 | 34,000 | ||||||||||||||
H.R. Cramer | 31,350 | 38,500 | 38,500 | 38,500 | 38,500 | 216,700 | 54,488 | |||||||||||||||||||||
M.E. Foster | 20,350 | 27,500 | 33,000 | 40,000 | 45,400 | 186,600 | 12,000 | 27,500 | 33,000 | 40,000 | 45,400 | 0 | 186,600 | 12,000 | ||||||||||||||
P.E. Sullivan | 17,000 | 23,100 | 25,500 | 27,500 | 0 | 110,100 | 24,000 | |||||||||||||||||||||
| * | Restrictions lapse on Career Shares on the first day of the calendar year following retirement with the exception of the restricted stock units granted to |
Option Exercises and Stock Vested for 20072008
| Name | Option Awards | Stock Awards | ||||||
Number of Shares Acquired on Exercise (#) | Value Realized on Exercise ($) | Number of Shares (#) | Value Realized on Vesting ($) | |||||
R.W. Tillerson | 80,000 | 3,061,500 | 53,500 | 4,563,015 | ||||
D.D. Humphreys | 42,210 | 1,795,014 | 17,000 | 1,449,930 | ||||
S.R. McGill | 274,846 | 10,544,695 | 34,950 | 2,980,886 | ||||
J.S. Simon | 88,358 | 4,551,354 | 34,950 | 2,980,886 | ||||
H.R. Cramer | 100,000 | 4,884,000 | 31,350 | 2,673,842 | ||||
M.E. Foster | 96,903 | 4,107,717 | 20,350 | 1,735,652 | ||||
P.E. Sullivan | 10,057 | 314,259 | 17,000 | 1,449,930 | ||||
| Name | Option Awards | Stock Awards | ||||||
Number of Shares Acquired on Exercise (#) | Value Realized on Exercise ($) | Number of Shares (#) | Value Realized on Vesting ($) | |||||
R.W. Tillerson | 0 | 0 | 53,500 | 4,215,265 | ||||
D.D. Humphreys | 20,000 | 997,575 | 18,350 | 1,445,797 | ||||
H.R. Cramer | 71,964 | 3,838,920 | 31,350 | 2,470,067 | ||||
C.W. Matthews | 110,000 | 5,417,538 | 20,350 | 1,603,377 | ||||
S.D. Pryor | 172,838 | 8,704,641 | 33,950 | 2,674,921 | ||||
J.S. Simon | 39,137 | 2,044,519 | 36,700 | 2,891,593 | ||||
M.E. Foster | 0 | 0 | 20,350 | 1,603,377 | ||||
Option Awards
| Ÿ | The value realized on option awards represents the difference between the option exercise price and the market price of ExxonMobil stock on date of exercise. |
| Ÿ | The net number of shares acquired as a result of all exercises during |
Stock Awards/Restriction Lapse in 20072008
| Ÿ | Restrictions lapsed on 50 percent of stock awards that were granted in |
| Ÿ | The number of shares acquired on vesting is the gross number of shares to which the award relates. |
| Ÿ | The value realized is the gross number of shares times the market price, which is the average of the high and low sale prices on the NYSE on the date that restrictions lapse. |
| Ÿ | The net number of shares acquired (gross number of shares less shares withheld for taxes) |
| Ÿ | Refer to pages |
Career Shares Distribution
| Ÿ | Messrs. |
| Ÿ | All other shares granted to Messrs. |
| Name | Plan Name | Number of (#) | Present Value of ($) | Payments During Last Fiscal Year ($) | Plan Name | Number of (#) | Present Value of ($) | Payments During Last Fiscal Year ($) | ||||||||||
R.W. Tillerson | ExxonMobil Pension Plan | 32.58 | 1,124,189 | 0 | ExxonMobil Pension Plan | 33.58 | 1,330,660 | 0 | ||||||||||
| ExxonMobil Supplemental Pension Plan | 32.58 | 6,941,602 | 0 | ExxonMobil Supplemental Pension Plan | 33.58 | 9,436,657 | 0 | |||||||||||
| ExxonMobil Additional Payments Plan | 32.58 | 15,980,753 | 0 | ExxonMobil Additional Payments Plan | 33.58 | 21,569,425 | 0 | |||||||||||
D.D. Humphreys | ExxonMobil Pension Plan | 31.40 | 1,394,700 | 0 | ExxonMobil Pension Plan | 32.40 | 1,512,694 | 0 | ||||||||||
| ExxonMobil Supplemental Pension Plan | 31.40 | 3,605,804 | 0 | ExxonMobil Supplemental Pension Plan | 32.40 | 4,407,828 | 0 | |||||||||||
| ExxonMobil Additional Payments Plan | 31.40 | 10,826,483 | 0 | ExxonMobil Additional Payments Plan | 32.40 | 14,505,657 | 0 | |||||||||||
S.R. McGill | ExxonMobil Pension Plan | 39.61 | 0 | 1,464,680 | ||||||||||||||
H.R. Cramer | ExxonMobil Pension Plan | 35.58 | 1,609,138 | 0 | ||||||||||||||
| ExxonMobil Supplemental Pension Plan | 35.58 | 4,401,242 | 0 | |||||||||||||||
| ExxonMobil Additional Payments Plan | 35.58 | 12,423,572 | 0 | |||||||||||||||
C.W. Matthews | ExxonMobil Pension Plan | 37.96 | 1,643,942 | 0 | ||||||||||||||
| ExxonMobil Supplemental Pension Plan | 37.96 | 4,530,908 | 0 | |||||||||||||||
| ExxonMobil Additional Payments Plan | 37.96 | 11,062,187 | 0 | |||||||||||||||
S.D. Pryor | ExxonMobil Pension Plan | 37.17 | 1,700,523 | 0 | ||||||||||||||
| ExxonMobil Supplemental Pension Plan | 39.61 | 0 | 5,515,680 | * | ExxonMobil Supplemental Pension Plan | 37.17 | 5,076,474 | 0 | ||||||||||
| ExxonMobil Additional Payments Plan | 39.61 | 0 | 15,601,776 | * | ExxonMobil Additional Payments Plan | 37.17 | 13,241,260 | 0 | ||||||||||
J.S. Simon | ExxonMobil Pension Plan | 41.01 | 1,766,496 | 0 | ExxonMobil Pension Plan | 41.43 | 0 | 1,838,255 | * | |||||||||
| ExxonMobil Supplemental Pension Plan | 41.01 | 5,655,973 | 0 | ExxonMobil Supplemental Pension Plan | 41.43 | 0 | 5,968,286 | |||||||||||
| ExxonMobil Additional Payments Plan | 41.01 | 16,996,428 | 0 | ExxonMobil Additional Payments Plan | 41.43 | 0 | 17,361,681 | |||||||||||
H.R. Cramer | ExxonMobil Pension Plan | 34.58 | 1,386,756 | 0 | ||||||||||||||
| ExxonMobil Supplemental Pension Plan | 34.58 | 3,607,635 | 0 | |||||||||||||||
| ExxonMobil Additional Payments Plan | 34.58 | 10,224,434 | 0 | |||||||||||||||
M.E. Foster | ExxonMobil Pension Plan | 42.58 | 1,811,137 | 0 | ExxonMobil Pension Plan | 42.83 | 0 | 1,849,080 | ||||||||||
| ExxonMobil Supplemental Pension Plan | 42.58 | 4,238,611 | 0 | ExxonMobil Supplemental Pension Plan | 42.83 | 0 | 4,467,778 | |||||||||||
| ExxonMobil Additional Payments Plan | 42.58 | 13,395,499 | 0 | ExxonMobil Additional Payments Plan | 42.83 | 0 | 13,680,687 | |||||||||||
P.E. Sullivan | ExxonMobil Pension Plan | 37.98 | 0 | 1,643,383 | ||||||||||||||
| ExxonMobil Supplemental Pension Plan | 37.98 | 0 | 2,881,659 | |||||||||||||||
| ExxonMobil Additional Payments Plan | 37.98 | 0 | 8,454,627 | |||||||||||||||
| * | Payment was deferred until |
Pension Plan
| Ÿ | The tax-qualified pension plan provides a benefit calculated as an annual annuity beginning at age 65 (the Plan’s normal retirement age) equal to 1.6 percent of the participant’s final average salary |
| – | Final average salary is the average of the highest 36 consecutive months in the 10 years of service prior to retirement. |
| – | Final average salary included and benefits paid are subject to the limits on compensation ($ |
| Ÿ | The benefit is available as a lump sum or in various annuity forms. |
| Ÿ | The defined benefit pension arrangements (qualified and nonqualified) help to attract and retain employees at all levels of the Corporation. |
| Ÿ | The defined benefit pension plan provides a strong incentive for employees to stay until retirement age. |
| Ÿ | The plan uses final average pay applied to all years of service, and thus, the increase in pension values is greatest late in career, when compensation tends to be highest. This retention feature is strong for high performers, whose compensation increases as their job responsibilities continue to expand throughout their career, making their level of retirement income performance-based. |
Supplemental Pension Plan
| Ÿ | The nonqualified plan provides a benefit calculated as an annuity on salary above the Internal Revenue Code limit. |
| Ÿ | It is calculated as an annual annuity beginning at age 65 equal to 1.6 percent of the participant’s final average salary over the Internal Revenue Code |
| Ÿ | To help meet the retention and performance objectives described for U.S. salaried employees, the Supplemental Pension Plan provides pension benefits to the extent annual pay exceeds the amount that can be considered in determining qualified pension benefits ($ |
| Ÿ | Without the Supplemental Pension Plan, the retention power of the overall pension plan would be greatly reduced for employees earning more than that amount, since the increase in their pension values in mid- to late-career would be based on relatively flat final average pay. |
Additional Payments Plan
| Ÿ | The nonqualified plan provides a benefit calculated as an annual annuity beginning at age 65 equal to 1.6 percent of the participant’s average annual bonus multiplied by years of |
| – | The plan uses the |
|
| Ÿ | Benefits under the Additional Payments Plan are forfeited if an employee resigns prior to completion of 15 years of service and attainment of age 55. All of the Named Executive Officers have satisfied these conditions. |
| Ÿ | The objective of the Additional Payments Plan is to support retention and performance objectives in light of the Compensation Committee’s practice of putting higher percentages of annual cash compensation at risk at higher executive levels. |
| Ÿ | The Compensation Committee believes that even though a large percentage of annual cash compensation is discretionary and based on Corporate business performance, it should not be excluded from the pension calculation. Inclusion of discretionary bonuses in the pension formula strengthens the performance basis of such bonuses. |
| Ÿ | By limiting bonuses to those granted in the five years prior to retirement, there is a strong motivation for executives to continue to perform at a high level. |
| Ÿ | The Additional Payments Plan is designed to be a powerful retention tool, since benefits are forfeited if the employee resigns prior to completion of 15 years of service and attainment of age 55. The plan applies on the same terms to all U.S. salaried employees who receive a bonus. |
Present Value Pension Calculations
| Ÿ | The present value of accumulated benefits shown in the “Pension Benefits” table is determined by converting the annuity values earned as of year end to lump sum values payable at age 60 (or at the employee’s actual age, if older) using the mortality tables and interest rate |
| Ÿ | The actual lump sum conversion factors that will apply when each executive retires could be different. For executives who were not yet 60, the present value as of year-end |
Other Plan Terms
| Ÿ | All three pension plans require attainment of age 55 and completion of 15 years of service to be eligible for early retirement. All Named Executive Officers have satisfied this requirement. |
| Ÿ | The early retirement benefit consists of an annuity that is undiscounted for retirement ages of 60 years or over, with a discount of 5 percent for each year under age 60. |
| Ÿ | In addition the Social Security offset is waived for annuity payments scheduled to be paid prior to age 62. |
| Ÿ | Because early retirement benefits are subject to a smaller discount than a full actuarial equivalent discount, they can be more valuable than the present value of the |
| Ÿ | Messrs. Tillerson, Cramer, and |
| Ÿ | The table below shows the lump sum early retirement benefits under the three plans for the Named Executive Officers who are under age 60 as of year-end |
| Name | Plan Name | Lump Sum
| ||
R.W. Tillerson | ExxonMobil Pension Plan | |||
| ExxonMobil Supplemental Pension Plan | ||||
| ExxonMobil Additional Payments Plan | ||||
H.R. Cramer | ExxonMobil Pension Plan | |||
| ExxonMobil Supplemental Pension Plan | ||||
| ExxonMobil Additional Payments Plan | ||||
S.D. Pryor | ExxonMobil Pension Plan | 1,755,786 | ||
| ExxonMobil Supplemental Pension Plan | 5,219,426 | |||
| ExxonMobil Additional Payments Plan | 13,614,130 |
Form of Nonqualified Pension Payments
| Ÿ | The benefits under the ExxonMobil Supplemental Pension Plan and the ExxonMobil Additional Payments Plan are payable only in the form of a single lump sum six months following retirement. |
| Ÿ | The payment is equal to the pension balance plus interest for the six-month waiting period at the Citibank prime lending rate or a lump sum amount recalculated using the discount rate in effect at the time of payment, whichever is greater. |
| Ÿ | The retirement distributions to |
| Name | Plan Name | Interest ($) | ||
J.S. Simon | ExxonMobil Supplemental Pension Plan | 146,055 | ||
| ExxonMobil Additional Payments Plan | 424,359 | |||
M.E. Foster | ExxonMobil Supplemental Pension Plan | 115,064 | ||
| ExxonMobil Additional Payments Plan | 352,175 |
Service Credit Multipliers
| Ÿ | Under the Company’s U.S. retirement plans, only actual service with Exxon Mobil Corporation or an affiliated company is recognized under current plan rules. |
| Ÿ | Historically the Company provided a “service credit multiplier” for foreign service in specified geographic areas, which has since been discontinued under U.S. and other country pension plans. |
| Ÿ |
|
| Ÿ | All service of the Named Executive Officers is under the U.S. pension |
Nonqualified Deferred Compensation for 20072008
| Name | Executive ($) | Registrant ($) | Aggregate Earnings in Last FY ($) | Aggregate ($) | Aggregate Balance at Last FYE ($) | Executive ($) | Registrant ($) | Aggregate Earnings in Last FY ($) | Aggregate ($) | Aggregate Balance at Last FYE ($) | ||||||||||
R.W. Tillerson | 0 | 91,500 | 30,649 | 0 | 474,108 | 0 | 114,800 | 27,458 | 0 | 616,366 | ||||||||||
D.D. Humphreys | 0 | 37,350 | 21,309 | 0 | 315,594 | 0 | 47,600 | 17,503 | 0 | 380,697 | ||||||||||
S.R. McGill | 0 | 20,800 | 34,790 | 0 | 473,891 | |||||||||||||||
H.R. Cramer | 0 | 42,933 | 60,202 | 0 | 1,229,300 | |||||||||||||||
C.W. Matthews | 0 | 44,888 | 20,969 | 0 | 447,935 | |||||||||||||||
S.D. Pryor | 0 | 47,250 | 49,113 | 0 | 1,010,650 | |||||||||||||||
J.S. Simon | 0 | 46,200 | 38,294 | 0 | 552,490 | 0 | 14,233 | 25,799 | 580,859 | 0 | ||||||||||
H.R. Cramer | 0 | 34,975 | 80,958 | 0 | 1,126,165 | |||||||||||||||
M.E. Foster | 0 | 34,725 | 33,557 | 0 | 481,302 | 0 | 0 | 18,163 | 491,482 | 0 | ||||||||||
P.E. Sullivan | 0 | 1,665 | 18,705 | 270,479 | 0 | |||||||||||||||
| Ÿ | The table above |
| Ÿ | The amounts in the “Summary Compensation Table” include both Company contributions to the tax-qualified plan and Company credits to the nonqualified plan, whereas the registrant contributions in the table above represent only the Company credits to the nonqualified plan. |
| Ÿ | The amount of Company contributions to the tax-qualified savings plan was limited to the Internal Revenue Service contribution and salary maximums. For this reason, |
| Ÿ | The aggregate balance at the last fiscal year end shown above includes amounts reported as Company contributions in the “Summary Compensation Table” of the current proxy statement and in prior-year proxy statements as follows: |
| Ÿ | The nonqualified savings plan provides employees with the |
| – | All eligible employees participate in the nonqualified plan on the same basis. |
|
| – | Effective January 1, 2008, the Company match was increased from 6 to 7 percent and the rate at which the nonqualified savings plan account bears interest during the term of a participant’s employment was changed from the Citibank prime lending rate to 120 percent of the long-term Applicable Federal |
| – | Distribution of the nonqualified plan is in a single lump sum six months from date of retirement. During this six-month period, the account bears interest at the Citibank prime lending rate. To the extent that this results in payment of amounts in excess of a market rate of interest, those amounts are included in the “Summary Compensation Table.” |
| Ÿ | The tax-qualified and nonqualified savings plans are designed to help attract and retain employees. The matching design is intended to encourage employees to contribute their own funds to the plan to receive the tax benefits available under the Internal Revenue Code. The supplemental savings plan serves similar purposes for salary or contributions in excess of the Internal Revenue Code limits referenced above. |
Administrative Services for Retired Employee Directors
| Ÿ | The Company provides certain administrative support to retired employee directors. |
| Ÿ | The support provided generally involves, but is not limited to, assistance with correspondence and travel arrangements relating to activities the retired directors are involved with that continue from their employment, such as board positions with nonprofit organizations. Given the nature of the support provided, a retired director’s spouse may also benefit from the support provided. |
| Ÿ | The Company also allows retired employee directors to use otherwise vacant office space at the Company’s headquarters. |
| Ÿ | It is not possible to estimate the future cost that may be incurred by the Company for providing these services to |
| – | The aggregate incremental cost of providing these services for all currently covered persons is approximately $190,000 per year. |
| – | This amount represents the compensation and benefit cost for support personnel allocated based on their estimated time dedicated to providing this service, as well as other miscellaneous office support costs. |
| Ÿ | ExxonMobil does not provide any special executive health care benefits. |
| Ÿ | Executives and their families are eligible to participate in the Company’s health care programs, including medical, dental, prescription drug, and vision care, on the same basis as all other U.S. salaried employees. |
| Ÿ | The terms and conditions of the programs for both current employees and retirees do not discriminate in scope, terms, or operation in favor of executive officers. |
| Ÿ | All U.S. salaried employees are entitled to payment of salary for any accumulated but unused vacation days at retirement or other termination of employment. |
| Ÿ | Payment for unused vacation is included in final payments of earned salary. |
Termination and Change in Control
| Ÿ | ExxonMobil executive officers are not entitled to any additional payments or benefits relating to termination of employment other than the retirement benefits previously described in the preceding compensation tables and narrative. |
| Ÿ | Executives are “at-will” employees of the Company.They do not have employment contracts, a severance program, or any benefits triggered by a change in control. |
|
| Ÿ | As discussed in greater detail above, unexercised stock options, unvested restricted stock, and any unpaid portion of an annual bonus are subject to forfeiture at the discretion of the Compensation Committee if an executive: |
| – | Engages in detrimental activity; or, |
| – | Terminates employment prior to standard retirement age (currently age 65 for U.S. executives), whether such termination is voluntary or involuntary. |
| Ÿ | The Board also adopted a recoupment policy in the event of a material negative restatement of the Corporation’s reported financial or operating results as described on page |
Payments in the Event of Death
| Ÿ | The only event that results in acceleration of the normal payment or vesting schedule of any benefit is death. In |
Also in the event of death, the executive’s estate or beneficiaries would be entitled to payment of the life insurance or death benefit as |
Section 16(a) Beneficial Ownership Reporting Compliance
Section 16(a) of the Securities and Exchange Act of 1934 requires that our executive officers and directors file reports of their ownership and changes in ownership of ExxonMobil stock on Forms 3, 4, and 5 with the SEC and NYSE. We are not aware of any unfiled reports and are not aware of any late reports for 2007 except as follows: Mr. Reinemund’s initial Form 3 ownership report following his election to the Board on May 30, 2007, inadvertently failed to include shares held by a trust for the benefit of Mr. Reinemund’s mother-in-law. Due to an administrative oversight, one form reporting the settlement of stock unit accounts in connection with the termination of the Corporation’s non-employee director deferred fee plan was filed late for each of Dr. King, Mrs. Nelson, and Mr. Palmisano.
| Name | Life Insurance Benefit ($) | |
R.W. Tillerson | 7,480,000 | |
D.D. Humphreys | 3,640,000 | |
H.R. Cramer | 3,360,000 | |
C.W. Matthews | 3,420,000 | |
S.D. Pryor | 3,620,000 | |
J.S. Simon | 3,640,000 | |
M.E. Foster | 3,010,000 |
The primary function of our Committee is oversight of the Corporation’s financial reporting process, public financial reports, internal accounting and financial controls, and the independent audit of the annual consolidated financial statements. Our Committee acts under a charter, which can be found on the ExxonMobil Web site atexxonmobil.com/governance. We review the adequacy of the charter at least annually. All of our members are independent, and four of our membersall are audit committee financial experts under Securities and Exchange CommissionSEC rules. We held 11 meetings in 20072008 at which, as discussed in more detail below, we had extensive reports and discussions with the independent auditors, internal auditors, and other members of management.
In performing our oversight function, we reviewed and discussed the consolidated financial statements with management and PricewaterhouseCoopers LLP (PwC), the independent auditors. Management and PwC told usindicated that the Corporation’s consolidated financial statements were fairly stated in accordance
with generally accepted accounting principles. We discussed significant accounting policies applied by the Corporation in its financial statements, as well as alternative treatments. We discussed with PwC matters covered by the Statement on Auditing Standards No. 61 (Communication with Audit Committees). In addition we reviewed and discussed management’s report on internal control over financial reporting and the related audit performed by PwC, which confirmed the effectiveness of the Corporation’s internal control over financial reporting.
We also discussed with PwC its independence from the Corporation and management, including the matters in Independence Standards communications PwC is required to provide us under applicable Public Company Accounting Oversight
Board Standard No. 1 (Independence Discussions with Audit Committees) and the letter and disclosures from PwC to us pursuant to Standard No. 1.(PCAOB) rules. We considered the non-audit services provided by PwC to the Corporation, and concluded that the auditors’ independence has been maintained.
We discussed with the Corporation’s internal auditors and PwC the overall scope and plans for their respective audits. We met with the internal auditors and PwC at each meeting, both with and without management present. Discussions included the results of their examinations, their evaluations of the Corporation’s internal controls, and the overall quality of the Corporation’s financial reporting.
We discussed with the Corporation’s management the comprehensive, long-standing risk management processes and reviewed several topics of interest.
Based on the reviews and discussions referred to above, in reliance on management and PwC, and subject to the limitations of our role described below, we recommended to the Board, and the Board has approved, the inclusion of the audited financial statements in the Corporation’sAnnual Report on Form 10-K for the year ended December 31, 2007,2008, for filing with the Securities and Exchange Commission.SEC.
We have also appointed PwC to audit the Corporation’s financial statements for 2008,2009, subject to shareholder ratification of that appointment.
In carrying out our responsibilities, we look to management and the independent auditors. Management is responsible for the preparation and fair presentation of the Corporation’s financial statements and for maintaining effective internal control. Management is also responsible for assessing and maintaining the effectiveness of internal control over the financial reporting process in compliance with Sarbanes-Oxley Section 404 requirements. The independent auditors are responsible for auditing the Corporation’s annual financial statements, and expressing an opinion as to whether the statements are fairly stated in conformity with generally accepted accounting principles. In addition the independent auditors are responsible for auditing the Corporation’s internal controls over financial reporting and for expressing an opinion on the effectiveness of internal control over financial reporting. The independent auditors perform their responsibilities in accordance with the standards of the Public Company Accounting Oversight Board.PCAOB. Our members are not professionally engaged in the practice of accounting or auditing, and are not experts under the Securities Act of 1933 in either of those fields or in auditor independence.
| James R. Houghton, Chair | Larry R. Faulkner | |||
| Michael J. Boskin | Steven S Reinemund |
ITEM 2 – RATIFICATION OF INDEPENDENT AUDITORS
The Audit Committee has appointed PricewaterhouseCoopers LLP (PwC) to audit ExxonMobil’s financial statements for 2008.2009. We are asking you to ratify that appointment.
Total Fees
The total fees paid tofor PwC for professional services rendered to ExxonMobil for the fiscal year ended December 31, 2007,2008, were $52.6$34.9 million, an increasea decrease of $4.3$17.7 million from 2006.2007. The Audit Committee reviewed and pre-approved all services in accordance with the service pre-approval policies and procedures, which can be found on the ExxonMobil Web site atexxonmobil.com/governance. The Audit
Committee did not use the “de minimis” exception to pre-approval that is available under SEC rules. The following table summarizes the fees, which are described in more detail below.
| 2007 | 2006 | 2008 | 2007 | |||||
| (millions of dollars) | (millions of dollars) | |||||||
Audit Fees | 25.5 | 25.9 | 24.8 | 25.5 | ||||
Audit-Related Fees | 5.5 | 3.9 | 6.1 | 5.5 | ||||
Tax Fees | 21.6 | 18.5 | 4.0 | 21.6 | ||||
All Other Fees | – | – | – | – | ||||
Total | 52.6 | 48.3 | 34.9 | 52.6 | ||||
Audit Fees
The aggregate fees paid tofor PwC for professional services rendered for the annual audit of ExxonMobil’s financial statements for the fiscal year ended December 31, 2007,2008, and for the reviews of the financial statements included in our quarterly reports on Form 10-Q for that fiscal year were $24.8 million (versus $25.5 million (versus $25.9 million for 2006)2007).
Audit-Related Fees
The aggregate fees billed byfor PwC for Audit-Related services rendered to ExxonMobil for the fiscal year ended December 31, 2007,2008, were $6.1 million (versus $5.5 million (versus $3.9 million in 2006)2007). These services were mainly comprised ofrelated to asset dispositions, benefit plan and joint venture audits, and attestation procedures related to cost certifications.
Tax Fees
The aggregate fees billed byfor PwC for Tax services rendered to ExxonMobil for the fiscal year ended December 31, 2007,2008, were $4.0 million (versus $21.6 million (versus $18.5 million for 2006)2007). These services are described below.
| Ÿ | PwC assisted in preparing tax returns for individual ExxonMobil expatriate employees. These fees were $2.6 million for 2008 (versus $20.2 million for |
| Ÿ | PwC also assisted various ExxonMobil affiliates with the preparation of local tax filings and related tax services. These fees were $1.4 million for |
All Other Fees
The aggregate fees billed byfor PwC for services rendered to ExxonMobil, other than the services described above under “Audit Fees,” “Audit-Related Fees,” and “Tax Fees,” for the fiscal year ended December 31, 2007,2008, were zero (also zero in 2006)2007).
Other than Audit-Related and Tax services of the type described above, ExxonMobil does not envision obtaining other non-audit services from PwC.
PwC has been ExxonMobil’s independent auditing firm for many years, and we believe they are well-qualified for the job. A PwC representative will be at the annual meeting to answer appropriate questions and to make a statement if he desires.
The Audit Committee recommends you vote FOR this proposal.
We expect Items 3 through 1913 to be presented by shareholders at the annual meeting. Following SEC rules, other than minor formatting changes, we are reprinting the proposals and supporting statements as they were submitted to us. We take no responsibility for them. On oral or written request to the Secretary at the address listed under “Contact Information” on page 3, we will provide information about the sponsors’ shareholdings, as well as the names, addresses, and shareholdings of any co-sponsors.
The Board recommends you vote AGAINST Items 3 through 1913 for the reasons we give after each one.
ITEM 3 — SHAREHOLDER PROPOSALS PROHIBITED– CUMULATIVE VOTING
This proposal was submitted by the Free Enterprise Action Fund, 12309 Briarbush Lane, Potomac, MD 20854.
“Resolved: That the Company amend its bylaws to no longer permit shareholders to submit precatory (non-binding or advisory) proposals for consideration at annual shareholder meetings, unless the board of directors takes specific action to approve submission of such proposals.
Supporting Statement:
Stock ownership has become politicized. Many shareholders own stock in publicly-owned corporations in order to use the corporations as a means of advancing the particular shareholders’ social or political agenda.
A primary tool of ‘activist’ or ‘nuisance’ shareholders is the submission of non-binding precatory (advisory) proposals for discussion and vote at annual meetings of shareholders.
Last year, activist and nuisance shareholders submitted 11 precatory proposals requesting that the Company take action that could result in increased activist shareholder pressure and influence over corporate governance, executive compensation, corporate political contributions, employment policy, and environmental practices.
We believe the purpose of such proposals is to harass and intimidate the Company into actions that it would not ordinarily undertake and that, in fact, may be harmful to the Company and bona fide shareholders.”Mr. Emil Rossi, P.O. Box 249, Boonville, CA 95415.
The“3 – Cumulative Voting
RESOLVED: Cumulative Voting. Shareholders recommend that our Board recommends you vote AGAINST this proposal fortake the following reasons:
The Board welcomes and encourages input from our shareholders. At the same time, the Board does not believe the proxy statement is the most appropriate venue forsteps necessary to adopt cumulative voting. Cumulative voting means that each shareholder may cast as many of the issues currently raised by shareholder proposals. However, the Board also does not believe the By-Law amendment proposed by the proponent is the best way to carry out reform of the shareholder proposal process at this time.
ITEM 4 – DIRECTOR NOMINEE QUALIFICATIONS
This proposal was submitted by Dr. Sydney Kay, 5718 Harvest Hill Road, Dallas, TX 75230.
“WHEREAS Most Director nominees come from businesses totally unrelated to the corporation to which they have been nominated.
WHEREAS It is known, throughout the financial industry, that Chairmen and CEOs have the power to appoint their own Boards of Directors. John Kenneth Galbraith, the renowned economist, said it bluntly: ‘Senior Executives in the great corporations of this country set their own salaries… and stock option deals… subject to the approval of the Board of Directors that they have appointed. Not surprisingly, the Directors go along.’ (The Dallas Morning News, 1-16-2000, p. 1/10E);votes as
equal to number of shares held, multiplied by the number of directors to be elected. A shareholder may cast all such cumulated votes for a single candidate or split votes between multiple candidates. Under cumulative voting shareholders can withhold votes from certain poor-performing nominees in order to cast multiple votes for others.
WHEREAS Most corporate BoardsStatement of Emil Rossi
Cumulative voting won 54%-support at Aetna and greater than 51%-support at Alaska Air in 2005 and in 2008. It also received greater than 53%-support at General Motors (GM) in 2006 and in 2008. The Council of Institutional Investorswww.cii.org and CalPERS recommended adoption of this proposal topic.
Cumulative voting allows a significant group of shareholders to elect a director of its choice – safeguarding minority shareholder interests and bringing independent perspectives to Board decisions. Cumulative voting also encourages management to maximize shareholder value by making it easier for a would-be acquirer to gain board representation. It is not necessarily intended that a would-be acquirer materialize, however that very possibility represents a powerful incentive for improved management of our company.
The merits of this Cumulative Voting proposal should also be considered in the United States consist of present or past Chairmen and/or CEOs and Presidents of other corporations who, back home,have or had the power to nominate their own Boards of Directors;
WHEREAS Directors, nominated in such a fashion, have been called ‘Puppets,’ by the author of this Proposal; ‘Flunkies’ by David Broder ofThe Washington Post, and ‘Rubber-Stampers’ by Steve Hamm ofBusinessWeek;
WHEREAS Paul Volcker, former Chairmancontext of the Federal Reserve Board, said, ‘Stock options have beenneed for improvements in our company’s corporate governance and in individual director performance. For instance in 2008 the principal source of egregious excesses in executive compensation over the past decade without exception.’ (Nightly Business Report, PBS, 9-17-2002)
WHEREAS Arthur Levitt, past Chairman of the Securitiesfollowing governance and Exchange Commission, said, ‘I spoke time and time again of the failure of the Board of Directors to do anything but act like absolute lambs in the face of their management companies.’ (Wall Street Week with Fortune, 11-8-2003, PBS-TV)
WHEREAS Sir J. E. E. Dalberg said, ‘Power tends to corrupt and absolute power corrupts absolutely’;
WHEREAS ALL the non-employee Directors,COMBINED, often do not own enough shares in the corporations to which they have been nominated to havegenuine feelings of fiduciary responsibility to its shareholders. Their allegiance tends to be directed to the Chairmen or CEOs who appointed them, as revealed in the enormously distorted Compensation Packages awarded to these Principal Executivesthat are often totally unrelated to corporate Performance as measured by the ‘Net Income’ reported to the SEC and recorded in the Annual Report.
WHEREAS Salaried employees shall NOT qualify as Director Nominees:Their presence on the Board corrupts and destroys its function as a truly and totally independent executive governance body.
WHEREASTo have a truly and totally independent executive governance Board of Directors the nominees must come from sources over which Chairmen, Presidents, CEOs, and the other Principal Corporative Executives have no input or control whatsoever;
THEREFORE, IT is RECOMMENDED that, to return ethics to the selection process, beginning with the 2009 Annual Meeting of the shareholders, to qualify for nomination to the Board of Directors ALL nominees shall be:performance issues were identified:
|
Only 59% of |
| Ÿ | Our key directors also served on boards rated ‘D’ by the Corporate Library: |
| James Houghton | Corning (GLW) | |
James Houghton had 39-years tenure at Corning. | ||
| Edward Whitacre | Anheuser-Busch (BUD) | |
Edward Whitacre had 20-years tenure at Anheuser-Busch. | ||
| Michael Boskin | Oracle (ORCL) | |
Michael Boskin had 14-years tenure at IBM. | ||
| William George | Goldman Sachs (GS) | |
William George was on 3 key committees at Goldman Sachs. | ||
| Larry Faulkner | Temple-Inland (TIN) | |
Larry Faulkner was on 2 key committees at Temple-Inland. | ||
| Samuel Palmisano | International Business Machines (IBM) | |
| Ÿ | James Houghton (on our audit committee) was designated as an ‘Accelerated Vesting’ director by The Corporate Library due to speeding up stock option vesting to avoid recognizing the related cost. |
| Ÿ | Marilyn Carlson Nelson had long tenure of 17-year tenure (independence concern) and was one of only 3-members on our nomination committee. |
| Ÿ | Our directors made sure that we could not vote on this established topic of cumulative voting at our 2008 annual meeting. Reference:Exxon Mobil Corporation (March 24, 2008) no action letter available through SECnethttp://secnet.cch.com. |
| Ÿ | We had no shareholder right to: |
Call a special meeting.
Vote on executive pay.
Cumulative voting.
An independent board chairman.
The above concerns show there is need for improvement. Please encourage our board to respond positively to this proposal:
Cumulative Voting
Yes on 3”
The Board recommends you vote AGAINST this proposal for the following reasons:
The Board believes the Corporation’s current processand long-standing method of voting for nominating, vetting,directors has resulted in a balanced and subsequently electing directorshighly effective Board of Directors who have represented the best interests of all shareholders, as demonstrated by ExxonMobil’s superior long-term performance. Accordingly the Board does not support this proposal.
ExxonMobil’s director election standards, like those of most major corporations, provide that the holder of each share of common stock is working effectively.entitled to cast one vote FOR – or WITHHOLD that vote from – each director nominee.
The Corporation’s Corporate Governance Guidelines require a director to tender his or her resignation if the director does not receive a majority of votes cast in favor of election. In the absence of a compelling reason, the resignation will be accepted. The Board believes this director resignation guideline provides shareholders a clear voice in director elections without disturbing the criteria suggestedequitable “one share - one vote” approach.
Cumulative voting provides the opportunity for special interest shareholder groups to gain a disproportionate voice in shareholder voting, including in the election of directors who represent special interest groups rather than the interests of all shareholders. This disproportionate voice is especially worrisome when coupled with a majority vote standard.
ITEM 4 – SPECIAL SHAREHOLDER MEETINGS
This proposal was submitted by Mr. Kenneth Steiner, 14 Stoner Avenue, 2M, Great Neck, NY 11021.
“4 – Special Shareowner Meetings
RESOLVED, Shareowners ask our board to take the proponent are entirely too narrowsteps necessary to amend our bylaws and would severely limit itseach appropriate governing document to give holders of 10% of our outstanding common stock (or the lowest percentage allowed by law above 10%) the power to call special shareowner meetings. This includes that such bylaw and/or charter text will not have any exception or exclusion conditions (to the fullest extent permitted by state law) that apply only to shareowners but not to management and/or the board.
Statement of Kenneth Steiner
Special meetings allow shareowners to vote on important matters, such as electing new directors, that can arise between annual meetings. If shareowners cannot call special meetings investor returns may suffer. Shareowners should have the ability to identifycall a special meeting when a matter merits prompt consideration.
This proposal topic won impressive support at the following companies based on 2008 yes and recruitno votes:
| Occidental Petroleum (OXY) | 66% | Emil Rossi (Sponsor) | ||
| FirstEnergy Corp. (FE) | 67% | Chris Rossi | ||
| Marathon Oil (MRO) | 69% | Nick Rossi |
Shareowners should have the most qualified candidatesability to serve on the Board.call a special meeting when a matter is sufficiently important to merit prompt consideration. Fidelity and Vanguard have supported a shareholder right to call a special meeting.
The proxy voting guidelines of many public employee pension funds also favor this right. Governance ratings services, such as The Corporate Library and Governance Metrics International, have taken special meeting rights into consideration when assigning company ratings.
Please encourage our board to respond positively to this proposal:
Special Shareowner Meetings –
Yes on 4”
The Board recommends you vote AGAINST this proposal also precludes any “salaried employees” from beingfor the following reasons:
ExxonMobil’s Corporate Governance Guidelines posted on our Web site indicate that a special meeting of shareholders may be called by a holder of not less than 10 percent of outstanding shares in accordance with New Jersey law upon a showing of good cause. The Board believes this proposal is therefore unnecessary and redundant.
By requiring a showing of good cause to call a special meeting, the Board. We believe that appropriate representation onexisting New Jersey statute better balances the Board frominterests of all shareholders by allowing shareholders of 10 percent or more of outstanding common stock to call a meeting for a legitimate purpose while protecting against the senior executive ranks of the Corporation is essentialpotential for a minority shareholder group to the Board’s effective operation.abuse this right.
ITEM 5 – INCORPORATE IN NORTH DAKOTA
This proposal was submitted by Mr. Chris Rossi, P.O. Box 249, Boonville, CA 95415.
“5 – Reincorporate in a Shareowner-Friendly State
Resolved: That shareowners hereby request that our board of directors take the necessary steps to reincorporate the Company in North Dakota with articles of incorporation that provide that the Company is subject to the North Dakota Publicly Traded Corporations Act.
Statement of Chris Rossi
This proposal requests that the board initiate the process to reincorporate the Company in North Dakota under the new North Dakota Publicly Traded Corporations Act. If our company were subject to the North Dakota act there would be additional benefits:
| Ÿ | There would be a right of proxy access for shareowners who owned 5% of our Company’s shares for at least two years. |
| Ÿ | Shareowners would be reimbursed for their expenses in proxy contests to the extent they are successful. |
| Ÿ | The board of directors could not be classified. |
| Ÿ | The ability of the board to adopt a poison pill would be limited. |
| Ÿ | Shareowners would vote each year on executive pay practices. |
These provisions, together with others in the North Dakota act, would give us as shareowners more rights than are available under any other state corporation law. By reincorporating in North Dakota, our company would instantly have the best governance system available.
The SEC recently refused to change its rules to give shareowners a right of access to management’s proxy statement. And the Delaware courts recently invalidated a bylaw requiring reimbursement of proxy expenses. Each of those rights is part of the North Dakota act. As a result, reincorporation in North Dakota is now the best alternative for achieving the rights of proxy access and reimbursement of proxy expenses. And at the same time those rights would become available to us as shareowners in a North Dakota corporation, our Company would also shift to cumulative voting, ‘say on pay,’ and other best practices in governance.
Our Company needs to improve its governance:
| Ÿ | The Corporate Librarywww.thecorporatelibrary.com, an independent research firm rated our company ‘High Concern’ in executive pay and only 59% of CEO pay was incentive-based. |
| Ÿ | Our directors also served on boards rated ‘D’ by the Corporate Library: |
| James Houghton | Corning (GLW) | |
| Edward Whitacre | Anheuser-Busch (BUD) | |
| Michael Boskin | Oracle (ORCL) | |
| William George | Goldman Sachs (GS) | |
| Larry Faulkner | Temple-Inland (TIN) | |
| Samuel Palmisano | International Business Machines (IBM) |
| Ÿ | James Houghton (on our audit committee) was designated as an ‘Accelerated Vesting’ director by The Corporate Library for speeding up stock option vesting to avoid recognizing the related cost. |
| Ÿ | Marilyn Nelson had long tenure of 17-years (independence concern) and was one of only 3-members on our nomination committee. |
| Ÿ | We had no shareholder right to: |
Call a special meeting.
Vote on executive pay.
Cumulative voting.
An independent Board Chairman.
Reincorporation in North Dakota provides a way to switch to a vastly improved system of governance in a single step. And reincorporation in North Dakota does not require a major capital investment or layoffs to improve financial performance.
I urge your support for Reincorporating in a Shareowner-Friendly State.”
The Board recommends you vote AGAINST this proposal for the following reasons:
Exxon Mobil Corporation has been incorporated in New Jersey for over 125 years. New Jersey corporate law is well-developed and has served the Company and its shareholders well over this period. The new North Dakota statute referenced by the proposal is untested, and, we believe, would subject the Company and our shareholders to substantial legal uncertainty. Therefore the Board does not support this proposal.
Reincorporation would also require a proxy solicitation for shareholders to approve a merger of the Company into a North Dakota corporation. This would require expenditure of substantial Company time and money without commensurate benefit. New Jersey law already supports a wide range of sound governance practices such as those already implemented by ExxonMobil. Moreover each of the items mentioned by the proponent as a reason to reincorporate can already be effected under New Jersey law if the Board determines such measures to be in the best interests of shareholders.
ITEM 6 – BOARD CHAIRMAN AND CEO
This proposal was submitted by clientsa client of Ram Trust Services, 45 Exchange Street, Portland, ME 04101, as lead proponent of a filing group.
“RESOLVED that the shareholders urge the BoardSections 4, 5 and 6 of Directors to take the necessary steps to amendArticle IV of the by-laws be amended to require that, whenever possible and subject to any presently existing contractual obligations ofread as follows:
| 4. | The chairman of the board shall preside at all meetings of shareholders and directors. The chairman of the board shall not otherwise be an officer or employee of the corporation and, subject to the board of directors, shall speak for, and direct the administration of the activities of, the board of directors. |
| 5. | The president shall be the chief executive officer of the corporation and, subject to the board of directors, shall have general care and supervision of the business and affairs of the corporation. |
| 6. | In the event of death, absence, or disability of the president, an executive or senior vice president may be designated by the board to exercise the powers and perform the duties of the president. |
the Company, an independent director shall serve as Chairman of the Board of Directors, and that the Chairman of the Board of Directors shall not concurrently serve as the Chief Executive Officer.
SUPPORTING STATEMENT
Lee Raymond, ExxonMobil CEO, but it’s the Board that must take the initiative, and Chairfunction independently, in some of the most important matters affecting the company. In our view, it is difficult for a board of 11 individuals to do so without some one individual charged with the responsibility of making it all work.
Exxon has a ‘lead director,’ Samuel Palmisano, the Chairman and chief executive of IBM. We hold him in high regard. However, we believe it unrealistic to think that a man with as demanding a job as running IBM could at the same time have the time to lead a board in managing Exxon and make it a top priority.
We therefore favor the concept of an independent nonexecutive chairman. The concept is neither new nor novel. Exxon’s principal worldwide competitors – British Petroleum, Royal Dutch Shell, Petrobras – all have independent nonexecutive chairmen.
The nonexecutive chairman does not merely preside at directors’ meetings. He directs the administration of all the Board’s activities. He is not an executive officer; but, by virtue of his time commitment and independent access, he is in a position to inform himself as to what in fact is going on and bring to the Board’s attention matters on which it should focus. He speaks for the Board and is available to those legitimately wishing to have contact with the Board.
It is sometimes argued that a company must speak with one voice. But the CEO/nonexecutive chairman model has been around for a long time and, in our view, has worked rather well. We believe shareholders wish to hear not only the voice of the CEO but the voice of the Board of Directors: ‘I move item number twoas well.
Our proposal is not intended as any implied criticism. However, even big companies can experience great difficulties, as recent events demonstrate, and questions are then raised whether the ratification of independent auditors, PricewaterhouseCoopers, as itdirectors should have exercised greater oversight. Our proposal is printedintended to provide a framework that, in your proxy statement. Are there any comments?’our view, will enable the Board to be more effective and proactive.
Dale McCormick, State Treasurer of Maine: ‘Good Morning, Mr. Raymond, I’m Dale McCormick, the Treasurer of the great State of Maine. (applause) Ah, IFor our full statement, please see people have been to our fair State and come again, please. I’m an Institutional Investor; I represent many Institutional Investors and I’d like to know if the auditor is here so that I might pose a question?’
website atLee Raymondwww.exxonaction.com: ‘Mr. Paterson, right down here.’
Dale McCormick: ‘Great, hello Mr. Paterson. I’d like to know what provisions you have made on the financial statements for damage caused by climate change. Climate change is a potential liability and I wonder if you have reserved for it on the balance sheet?’
Mr. Paterson: ‘The responsibility for provisions in the financial statements are those of management and I’m not sure that I am the appropriate person to respond to that question.’
Dale McCormick: ‘Thank you. Then may I pose that question to Mr. Houghton who is the chair of the audit committee?’
Lee Raymond: ‘You may not, you may not.’
Dale McCormick: ‘Why sir?’
Lee Raymond: ‘Because that’s not – the audit committee looks at the recommendations of management, that’s properly the responsibility of the controller of the corporation.’
Dale McCormick: ‘May I pose it to you?’
Lee Raymond: ‘Oh, sure. You can pose anything to me. (laughter)’
Dale McCormick: ‘Will you answer me then?’
Lee Raymond: ‘Oh, that’s a different question? (more laughter)’
Dale McCormick: ‘Sir, I do not think it is a matter of laughter when an institutional investor representing over 3 million shares can not get answers to an important question like this.’
Lee Raymond: ‘The question is precisely what?’
Dale McCormick: ‘What provisions have you made on the financial statements for the damage caused by climate change and the potential liability [resulting therefrom].’
Lee Raymond: ‘It’s neither likely nor could it be estimated.”
The Board recommends you vote AGAINST this proposal for the following reasons:
The Board believes that the decision as to who should serve as Chairman and Chief Executive Officer,CEO, and whether the offices should be combined or separated,separate, is properly the proper responsibility of the Board. The
members of the Board possess considerable experience and unique knowledge of the challenges and opportunities the Company faces. Theyfaces, and are therefore, in the best position to evaluate the current and future needs of the Company and how best to judge howorganize the capabilities of the Company’s directors and senior managers can be most effectively organized to meet those needs. The Board believes that the most effective leadership structure for Exxon Mobil Corporation at the present time is for Mr. Tillerson to serve as both Chairman and CEO.
The Board believes very strongly that there is NO single best organizational model that would beis the most effective in all circumstances. Thecircumstances, and the Board retains the authority to modifyseparate the positions of Chairman and CEO if it deems appropriate in the future. This proposal, however, which is structured this year as a binding, prescriptive By-Law amendment, would cause the Board to lose its flexibility to change the structure to best addressof the Company’s unique circumstances,Chairman and so advance the best interests of all shareholders,CEO positions, as and when appropriate.appropriate, to best serve the interests of shareholders. We also believe the proposal would create practical difficulties. Accordingly the Board does not support this proposal.
Further,To demonstrate its continuing commitment to strong corporate governance and Board independence, the Company has a strong governance structureBoard took steps in place with many processes2008 to provide forenhance the role of the Presiding Director. With these changes, the independent discussion among directors and for independent evaluation of, and communication with, many members of senior management. These governance processes are reflectedthe Board will annually select one of their members to serve as Presiding Director. It is normally expected that the same director will serve as Presiding Director for a minimum of two years. The Presiding Director will act as a liaison with the Chairman, in consultation with the Corporate Governance Guidelinesother directors, provided that each director will also be afforded direct and the various Committee Charters that are available on our Web site. Some of the relevant sections in these documents explain that:
|
|
|
ITEM 6 – SHAREHOLDER RETURN POLICY
This proposal was submitted by Mr. Edward Mergens, 420 East Log Hill Road, Pagosa Springs, CO 81147.
“During this period of record profits, the shareholders interests are not being protected by ExxonMobil’s management. Management needs to develop a formal policy that reflects the philosophy expressed in ExxonMobil’s interviews givencomplete access to the investment community by Senior Management. During these interviews, (notably one by CEO Tillerson on CNBC to Maria Bartoromo) the leadership repeatedly stressed that the sole objective of ExxonMobil’s investment program was increased fair return to the shareholders. When pressed by Bartoromo,Chairman at any time as to whether it wasn’t more likely using record earnings for increasing the company’s raw material positionsuch director deems necessary or market position, according to Mr. Tillerson, that’s not it, but was to insure a fair return to shareholders. However, when record profits were made in 2006, Exxon management did not use all in exploration spending or refining expansion, but instead took the remaining money from record profits earned to make only a minor return to shareholders, while putting a major part of those record profits in an ExxonMobil stock buyback program.
This proposal is about more equitable sharing of retained earnings. In illustration, ExxonMobil claimed a 12.3% increased payment to shareholders (see page 4 of the 2006 Annual Report). This was very misleading. Using the per share percentage figures shown on page 41 of the report it’s true. However in reality, cash actually paid to shareholders, (Financial Highlights on page 5), between 2005 vs. 2006 the increase was only 6%, meanwhile, ExxonMobil’s net income increased more than 9% during the same period.appropriate.
Thus, ExxonMobil retainedSpecific duties of the Presiding Director include chairing executive sessions of the non-employee directors and providing feedback from such sessions to the Chairman, and chairing meetings of the Board in the absence of the Chairman and President. In addition the Presiding Director reviews in advance, in consultation with the Chairman, the schedule and agenda for itself a higher percentageall Board meetings as well as materials distributed to the directors in connection therewith.
Executive sessions of its earnings, insteadthe non-employee directors are scheduled to follow each meeting of making commensurate return to shareholders. The corporation put with these retained record earnings money into a $25 billion fund to buy back its own shares, weakening shareholders position.
Itthe full Board. If the Board includes non-employee directors who are not independent, at least one executive session per year will include only the independent directors. Additional executive sessions may be argued that this program might benefit shareholders, providing a continuing demand for the stock, boosting the price. Unfortunately, this is largely theory, since stock price is mainly driven by earnings, and in this case, the price of crude oil, not buyback. However, stock repurchases do have other corporate benefits, not sharedconvened by the investors. In repurchasing, ExxonMobil can add shares to the authorized, but not issued stock pool. Once repurchased, ExxonMobil no longer has to pay money on that stock to shareholders. In this case, non-payment could save about $250 million annually. In addition, this self aggrandizement of the company, now allows issuing more stock options, which management solely decides, without input from others. Options are more likely, since options canPresiding Director at his or her discretion and will be made using the larger authorized stock pool.
In view of this disproportionate allocation of retained earnings, between shareholders and management, this proposal asks:
That the Management and the Board of Directors issue and adopt a policy statement, To Wit, that the ExxonMobil management and Board be boundconvened if requested by this policy directive, to give due consideration in its decisions of retained earnings so as to make a balanced allocation of such money between the return to shareholders and retaining fundsany other director. Any non-employee director may raise issues for other corporate use.”
The Board recommends you vote AGAINST this proposal for the following reasons:
The Board believes that this shareholder proposal is not in the best interests of the majority of the Corporation’s shareholders. The Board regularly considers the amount and mix of cash distributions to shareholders, consistent with the Corporation’s objective of growing long-term shareholder value. The proposed policy statement would constrain the Board’s ability to allocate funds in a manner consistent with the Corporation’s objective.
The Corporation has a long-standing shareholder distribution strategy designed to maximize value for all shareholders using both dividends and share buybacks. The Board believes that its strategy has served shareholders well as a group, balancing individual preferences, and that it remains the most effective approach to deliver the highest shareholder value.
The distribution strategy of the Corporation is intended to provide shareholders reliable and growing cash income over time through regular dividends and share appreciation created by reducing shares outstanding. Share buybacks are widely acknowledged in the business and academic communities as more efficient than dividends for the majority of shareholders.
Contrary to statements included in the proposal, the Company has not issued stock options to executives since 2001.
The Corporation has significantly increased total shareholder distributions by way of dividends and share buybacks in recent years. Total distributions reached $23 billion in 2005, or about 64 percent of earnings. Distributions further increased to $33 billion in 2006, and a record $36 billion in 2007, equivalent todiscussion at an earnings payout of 88 percent. The Corporation’s record over the last three years provides further evidence of the Board’s commitment to shareholder distributions.executive session.
ITEM 7 – SHAREHOLDER ADVISORY VOTE ON EXECUTIVE COMPENSATION
This proposal was submitted by The Needmor Fund, 3306 NW 71st Street, Seattle, WA 98117, as lead proponent of a filing group.
“RESOLVED, that shareholders of ExxonMobil request the board of directors to adopt a policy that provides shareholders the opportunity at each annual shareholder meeting to vote on an advisory resolution, proposed by management, to ratify the compensation of the named executive officers (‘NEOs’) set forth in the proxy statement’s Summary Compensation Table (the ‘SCT’) and the accompanying narrative disclosure of material factors provided to understand the SCT (but not the
Compensation Discussion and Analysis). The proposal submitted to shareholders should make clear that the vote is non-binding and would not affect any compensation paid or awarded to any NEO.
SUPPORTING STATEMENT
Investors are increasingly concerned about mushrooming executive compensation which sometimes appearsespecially when it is insufficiently linked to be insufficiently aligned with the creation of shareholder value. As a result, in 2007performance. In 2008, shareholders filed more than 60 ‘sayclose to 100 ‘Say on pay’Pay’ resolutions. Votes on these resolutions have averaged 43% in favor, including 40.8% at ExxonMobil, with companies, averaging a 42%ten votes over 50%, demonstrating strong shareholder support for this reform.
An Advisory Vote establishes an annual referendum process for shareholders about senior executive compensation. We believe the results of this vote where voted upon including 41% at ExxonMobil. In fact, eight resolutions received majority votes.would provide the board and management useful information about shareholder views on the company’s senior executive compensation.
In addition, theits 2008 proxy Aflac submitted an Advisory Vote resulting in a 93% vote in favor, indicating strong investor support for good disclosure and a reasonable compensation package. Daniel Amos, Chairman and CEO said, ‘An advisory vote was endorsedon our compensation report is a helpful avenue for our shareholders to provide feedback on our pay-for-performance compensation philosophy and pay package.’
To date eight other companies have also agreed to an Advisory Vote, including Verizon, MBIA, H&R Block, Blockbuster, and Tech Data. TIAA-CREF, the country’s largest pension fund, has successfully utilized the Advisory Vote twice.
Influential proxy voting service RiskMetrics Group, recommends votes in favor, noting: ‘RiskMetrics encourages companies to allow shareholders to express their opinions of executive compensation practices by theestablishing an annual referendum process. An advisory vote on executive compensation is another step forward in enhancing board accountability.’
The Council of Institutional Investors endorsed advisory votes and a survey by the Chartered Financial Analyst Institute found that 76% of its members favored giving shareholders an advisory vote. A bill to provide forallow annual advisory votes on compensation passed in the House of Representatives by a 2-to-1 margin.
Aflac decided to present such a resolution to investors in 2009 As presidential candidates, Senators Obama and TIAA-CREF, the largest pension fund in the world, held its first Advisory Vote in 2007. As a result of discussions between investors and companies, a Working Group onMcCain supported the Advisory Vote was established to further study how such a practice would be implemented in the U.S. markets to provide advice to investors and companies alike.Vote.
We believe that existing U.S. corporate governance arrangements, including SECSecurities and Exchange Commission rules and stock exchange listing standards do not provide shareholders with sufficient mechanisms for providing input to boards on senior executive compensation. In contrast, to U.S. practices, in the United Kingdom, public companies allow shareholders to cast an advisory
a vote on the ‘directors’ remuneration report,’ which discloses executive compensation. Such a vote isn’t binding, but gives shareholders a clear voice that could help shape senior executive compensation.
Currently U.S. stock exchange listing standards require shareholder approval of equity-basedWe believe that a company that has a clearly explained compensation plans; those plans, however, set general parametersphilosophy and accord the compensation committee substantial discretion in making awardsmetrics, reasonably links pay to performance, and establishing performance thresholds forcommunicates effectively to investors would find a particular year. Shareholders do not have any mechanism for providing ongoing feedback on the application of those general standards to individual pay packages.management sponsored Advisory Vote a helpful tool.
If investors wish to register opposition to a pay package(s) in the previous year, withholding votes from compensation committee members who are standing for reelection is a blunt and insufficient instrument for registering dissatisfaction.
Accordingly, weWe urge theour board to allow shareholders to express their opinion about senior executive compensation by establishingthrough an annual referendum process. The results of such a vote could provide our board with useful information about shareholder views on the company’s senior executive compensation, as reported each year.Advisory Vote.”
The Board recommends you vote AGAINST this proposal for the following reasons:
The Board believesagrees that input from shareholders should play an important role in the Companydesign of executive compensation programs. Accordingly the Board has demonstrated thatalready put in place a thorough, thoughtful, and transparent approach to executive compensation – including a number of very effective ways for shareholders to express their views on these matters – is already in place at ExxonMobil. Therefore,matters. The Board does not believe the Board believes the adoption of an advisory vote policy as suggested by the proponent is unnecessary and not warranted.would be helpful or effective for this purpose.
The Compensation Committee is responsible for defining and explaining the Company’s overall executive compensation philosophy, and administering and approving all elements of compensation for the Company’s senior executives. In carrying out these responsibilities, the Committee is committed to actAs described in detail in the best interests of both the Company“Compensation Discussion and its shareholders.
As outlinedAnalysis” and accompanying tables in this proxy a strongstatement, ExxonMobil’s executive compensation designprogram consists of a number of elements carefully designed to support ExxonMobil’s specific circumstances and business goals. A simple up or down vote on this program would not convey useful information to the Board as to the specific element of the program with which a shareholder may have a concern or the nature of that concern.
We also believe widespread adoption of the advisory vote on compensation would have the negative effect of encouraging companies to take a “one size fits all” approach to compensation under which programs would be designed with reference to standardized voting guidelines of proxy advisory firms, rather than to the particular facts and circumstances of the business.
From a practical standpoint, shareholders are not able to review the full range of information concerning a company – including information on business strategy and outlook, competitive positioning, corporate culture, and employee performance – taken into account by the Board in making executive compensation decisions. Substituting the judgment of shareholders for the judgment of the Board on these matters would result in a less-informed decision-making process, exists. and would circumvent the role of the Board in representing shareholders – a role that has been fundamental to the long-term success and competitive advantage of ExxonMobil.
The Board works diligentlyand management recognize the importance of improving the public’s understanding of ExxonMobil’s executive compensation program, addressing disclosure issues, and improving shareholder involvement. Public awareness and understanding are essential; therefore, changes continue to ensure thatbe made to the Company’s“Compensation Discussion and Analysis” section in this proxy statement to improve knowledge of how executive compensation philosophylinks to and elements drive behavior that is aligned withsupports the business strategies and long-term shareholder value creation.success of the Company. The “Compensation Discussion and Analysis” (CD&A) clearly describesincludes a conceptual model and summary description to illustrate how our plansbusiness and people strategies are designedfully integrated to achieve superior results and administered. As explained in detail increate shareholder value.
We believe the
CD&A section of this proxy statement, we believe ExxonMobil’s superior performance clearly shows that our executive compensation program is achieving its intended goals.
The Directors have unique, direct knowledge of senior executives’ performance, participateand the existing communication channels provide shareholders the ability to share input directly inwith the Company’s strategy development, and are advised by professional compensation consultants. Any vote by shareholders would be basedBoard on incomplete information.
The Board believes the detailed disclosure in the proxy statement provides shareholders with sufficient informationspecific concerns relating to understand how the Compensation Committee has discharged its responsibilities.compensation. Shareholders who wish to express their views to the Board have several effective ways to do so – all of which are considerably clearer, and, therefore, more effective than an up or down advisory vote. Shareholders can:
| Ÿ | Write to any Board member or group of Board members and describe their views specifically on executive compensation or on any other material |
| Ÿ | E-mail any Board member or group of Board members through the communication portal on the Company’s Web |
| Ÿ | Write or e-mail Company management representatives and discuss specific concerns with the appropriate department managers and/or |
| Ÿ | Attend the annual meeting of shareholders and express their views in that forum. |
The Board has proactively addressed compensation design to ensure the Company’s compensation approach achieves the Board’s objectives. In some cases this means we lead changes, and in other cases we have not adopted popular approaches because they were not aligned with the long-term nature of our business. For example:
|
|
|
|
|
The Board believes these examples demonstrate that the Company is responsive to shareholder input, and to governance developments, and that therefore the processes in place to receive and consider shareholder feedback are effective.
ITEM 8 – EXECUTIVE COMPENSATION REPORT
This proposal was submitted by NorthStar Asset Management Inc., 43 St. John Street, Jamaica Plain, MA 02130.
“WHEREAS: In 2006,WHEREAS, in 2007, the total compensation of our CEO Rex Tillerson exceeded $13$16 million including salary, bonus, restricted stock, and the value of his stock awards. In addition, SEC filings report that he holds stock options valued at $53an additional $16 million and has pension benefits valued at over $18.5 million.
In contrast, the average US worker made just over $29,000 last year. While Mr. Tillerson brought home $50,000a day, the average US worker’s daily pay was just over $100.$24 million;
In 1980, CEOs in the US were paid 40 times the average worker. Today, they are paid 344 times more.
Last year, Mr. Tillerson was paid 440541 times the average US worker. This type of over-compensation is increasingly being called into question by consumers, politicians and shareholders, and erodes customer trust and loyalty, potentially negatively affecting shareholder value;
The New York Times reports, ‘Analysts estimate that every $1 increase inIn 2007, ExxonMobil share prices increased by 24%, the per-barreltotal market capitalization of the company increased by $19 billion dollars, and Mr. Tillerson’s compensation increased by 28%.
However, as of December 5, 2008, ExxonMobil’s share price has declined 19% and market capitalization has gone down by $88 billion. Yet, according to a November 25, 2008 ExxonMobil SEC filing, Mr. Tillerson was awarded a $4 million bonus and 225,000 shares of oil translates intorestricted stock. In addition, Mr. Tillerson will receive a 1.5% increase in ExxonMobil’s earnings. Because a significant portion of executive pay at ExxonMobil is related to earnings growth..., rising oil prices mean bigger paychecks.’10% raise for 2009.
Additionally, legislationLegislation passed by the House of Representatives in April 2007, and currently being considered in the Senate, requires shareholders’ approval of executive compensation packages.packages;
ExxonMobil prides itself on being a low cost operation. Yet we clearly pay our CEO on a grand scale. AsRESOLVED, shareholders it is essential to understand specifically how this level of compensation creates shareholder value.
RESOLVED:
Shareholders request the Board to initiate a review of our company’s executive compensation policies and to make available, upon request, a report of that review by December 1, 20082009 (omitting confidential information and prepared at a reasonable cost). We request the report include:
| 1. | A comparison of the increase in the total compensation package of our CEO between 1998 and |
| 2. | An analysis of changes in the relative size of the gap between the two groups and the rationale justifying this trend. |
Supporting Statement
We believe all ExxonMobil employees work together to create value for shareholders and customers. We also believe the company has the ability to increase shareholder value by reinvesting in the whole company, not just a single individual. It is not clear how the company’s executive pay incentives are creating the desired and beneficial effect on shareholder value. As shareholders we are concerned that the over-compensation of top executives has a negative effect on employee morale and customer trust.
Please vote FOR this resolution.”
The Board recommends you vote AGAINST this proposal for the following reasons:
The Board does not support this proposal because executive compensation is already benchmarked annually against other large U.S.-based companies across industry, aligned internally to be equitable, and reviewed annually by the Compensation Committee, which consists solely of independent directors. The Board believes the compensation information disclosed in the proxy statement, which includes a detailed discussion of our compensation goals and methods, provides information that is more meaningful for shareholders than the analysis that is requested by this proposal.
The basis of ExxonMobil’s compensation program is to compensate each individual, executive or non-executive, at a level that recognizes the individual’s experience, performance, and level of responsibility. Compensation should be competitive with that of persons performing similar jobs at other
companies with whom the Company competes for employee talent.
ExxonMobil’s compensation programs are internally aligned, but the Committee does not believe a specific numeric ratio between the increase in the compensation of the CEO and the compensation of an employeeincrease in an entirely different jobaverage U.S. per capita income is meaningful or an appropriate factor infor setting compensation.
The “Compensation Discussion and Analysis” section beginning on page 19 ofin this proxy statement provides a detailed discussion of our compensation goals and methods.
ITEM 9 – INCENTIVE PAY RECOUPMENT
This proposal was submitted by Mr. Chris Rossi, P.O. Box 249, Boonville, CA 95415.
“9 – Recoup Unearned Management Bonuses
RESOLVED: Shareholders request our board to adopt a bylaw to enable our company to recoup all unearned incentive bonuses or other incentive payments to all senior executives to the extent that their corresponding performance targets were later reasonably determined to have not been achieved or resulted from error(s). This is to be adopted as a bylaw unless such a bylaw format is absolutely impossible. If such a bylaw were absolutely impossible, then adoption would be as a policy. The Securities and Exchange Commission said there is a substantive distinction between a bylaw and a policy. Restatements are one means to determine such unearned bonuses.
This proposal applies to all such senior executives who received unearned bonuses, not merely the executives who cooked the books. This would include that all applicable employment agreements and incentive plans adopt enabling or consistent text as soon as feasibly possible.
This proposal is not intended to unnecessarily limit our Board’s judgment in crafting the requested change in accordance with applicable laws and existing contracts and pay plans. Our Compensation Committee is urged – for the good of our company – to promptly negotiate revised contracts that are consistent with this proposal even if this means that our executives be asked to voluntarily give up certain rights under their current contracts.
This proposal topic won 62%-support at the Motorola 2007 annual meeting. This proposal is also similar to the proposal voted at the Computer Associates (CA) August 2004 annual meeting. In October 2003 Computer Associates announced that it had inflated income in the fiscal year ending March 31, 2000 by reporting income from contracts before they were signed.
Bonuses for senior executives in that year were based on income exceeding goals. Sanjay Kumar, then CEO, thus received a $3 million bonus based on Computer Associates’ supposedly superior performance. Subsequently Mr. Kumar did not offer to return his bonus based on discredited earnings. Mr. Kumar was later sentenced to 12-years in jail in regard to his employment at Computer Associates.
There is no excuse for over-compensation based on discredited earnings at any company. It is particularly important to support this proposal because of our history of outrageous CEO pay. For instance our ex-CEO Mr. Raymond was entitled to $350 million.
The scandal over backdated stock options is yet one more reminder that the executive class of many corporations seek over-compensation based on undeserved earnings.
Recoup Unearned Management Bonuses
Yes on 9”
The Board recommends you vote AGAINST this proposal for the following reasons:
The Board agrees with the proponent that senior executives should not profit on the basis of overstated financial or operating results. However, the Board believes this proposal is unnecessary since the Company has long had programs and practices in place to address the proponent’s concerns, and has taken steps to further clarify this intent.
The new Board Statement on Incentive Compensation in Case of Restatement, which is available on the ExxonMobil Web site, supports this view. Consistent with the Statement, the Board also amended the Short Term Incentive Program under which incentive bonuses and other payments are granted and paid to our executives to give the Board the right to require repayment from executive officers in case of a material negative restatement of financial or operating results.
With the addition of the new Board statement and incentive plan amendment described above, we believe that ExxonMobil has taken the necessary action to enable the Company to recoup compensation from executive officers as contemplated by the proposal. In fact, we believe the Company’s action is more effective for this purpose than a By-Law action would be, and, therefore, substantially implements the proposal.
Contrary to what is implied in the proposal, ExxonMobil executives are “at-will” employees of the Corporation and do not have employment contracts, severance agreements, or change in control arrangements with the Company.
ExxonMobil’s incentive programs are carefully structured so that at any given time, and in most cases for many years after retirement, a substantial portion of an executive’s personal net worth in the form of outstanding incentive awards will be subject to cancellation or forfeiture if the executive is found to have engaged in detrimental activity.
ITEM 10 – CORPORATE SPONSORSHIPS REPORT
This proposal was submitted by Dr. Martha Burk, 323 Morning Sun Trail, Corrales, NM 87048.
“Whereas,
ExxonMobil has a strong antidiscrimination statement, stating:
‘ExxonMobil’s policy on discrimination is clear and straightforward. Our all-inclusive, intentionally broad policy prohibits any form of discrimination or harassment, in any company workplace, anywhere in the world – and this policy applies equally to employees, supervisors, contractors, or anyone else in the company’s employ.’
Yet ExxonMobil’s antidiscrimination policy is not as straightforward regarding company expenditures for sponsorships and executive perks with institutions that don’t comply with the clear intent of its antidiscrimination statement.
ExxonMobil is a lead sponsor of the Masters Golf Tournament, owned by and held at Augusta National Incorporated, an organization that explicitly excludes women from membership.
Resolved,
Shareholders request the Board of Directors conduct a special review of ExxonMobil’s antidiscrimination statement as it pertains to corporate sponsorships and executive perks and publish a summary report addressing the following:
| 1) | What company funds are presently expended on corporate sponsorships and executive perks, like country club memberships and entertainment at or in conjunction with institutions that discriminate against groups protected by the company’s antidiscrimination statement? |
| 2) | Would the company sponsor an event held at a venue barring African Americans, Jews or homosexuals from membership? |
| 3) | How is the company’s antidiscrimination statement applied to decisions concerning sponsorships and executive perks? |
The report, prepared at reasonable cost and omitting proprietary information, shall be available to shareholders upon request no later than December 1, 2008.
Supporting Statement
ExxonMobil’s strong antidiscrimination statement demonstrates a commitment to workplace inclusion and opportunity. Failing to apply this statement to corporate sponsorships and executive perks undermines these laudable aspirations. Club memberships are more than about recreation, they are places where important business is conducted. Excluding people from these networking opportunities and decisionmaking venues on the basis of gender, race, religion or sexual orientation is a discriminatory practice denying equal opportunity.
Would ExxonMobil sponsor an event at a club explicitly barring African Americans or Jews from membership? If the answer is ‘no,’ then why would we sponsor events at institutions that explicitly bar women? ExxonMobil has made public statements that the company draws a distinction between race and gender, which is a harmful message for our employees, customers, and potential investors that the company does not value all of its employees equally. Event sponsorships at venues that discriminate against women also sends a message that gender discrimination is not taken seriously by ExxonMobil.
ExxonMobil has many talented women in high ranking positions. These women should in their own right be able to avail themselves of the networking opportunities that come with club membership, rather than having to be invited into these settings by male colleagues, who because of gender alone are eligible for membership.
Our company rightly extends coverage of its antidiscrimination statement to contractors. Why not also to sponsorships and executive perks purchased with shareholder funds?
Please join us in assuring that the ExxonMobil logo stands for the highest standards of antidiscrimination and vote FOR this proposal.”
The Board recommends you vote AGAINST this proposal for the following reasons:
ExxonMobil prohibits discrimination of any kind in its employment policies everywhere in the world. The Board believes the report requested is unnecessary given ExxonMobil’s unambiguous non-discriminationnondiscrimination policy. The Company determines which organizations and events to support based on an assessment of business needs, fit with corporate social objectives, and overall effectiveness. For example, ExxonMobil chooses to sponsor the Masters Tournament because it provides a unique opportunity to promote the Company’s messages, including our support for education, to its wide international audience.
ExxonMobil is committed to having a workplace that facilitates the maximum contribution from all of our employees. While there are many factors that are important to creating this type of environment, one of the most significant is having a workplace that is free from any form of harassment or discrimination.
ExxonMobil’s policies on non-discriminationnondiscrimination are clear and comprehensive. The Company is committed to fostering diversity in the workplace, as well as contributing to organizations that support diversity, especially in the area of education. ExxonMobil is consistently recognized as one of the leading supporters of women- and minority-owned businesses, in terms of actual business awarded.
ExxonMobil determines which organizations and events to support financially based on an assessment of business needs, fit with corporate social objectives, and overall effectiveness. The Company will continue to communicate about its diversity efforts through theCorporate Citizenship Report and on the Company’s Web site.
In addition, the Procurement Supplier Diversity Program encourages the hiring of women- and minority-owned companies that provide materials and services that are essential to our businesses.
2005 ExxonMobil launched itsour Educating Women and Girls Initiative (EWGI) in 2005.. EWGI provides funding and applies the Company’s core business and management expertise to help women and girls realize their full potential. Projects funded by EWGI help reduce barriers that prevent girls from attending school, andto education, give women training to start or improve businesses and nongovernmental organizations.organizations, and help women to be catalysts for progress and development in their communities. In 2008 EWGI made grants totaling more than $8 million – bringing cumulative investment to almost $20 million.
In 2008 ExxonMobil continued support for the Centre for Development and Population Activities’ Global Women in Management Program. Two hundred women from 35 countries have now been trained. This Program helps strengthen financial management skills of women managers working in community organizations in developing countries.
Reflecting our commitment to diversity, ExxonMobil supports networks for female, African-American, Hispanic, and AsianHispanic employees that provide mentoring, coaching, and strategies to enhance personal and professional development.
The Company also supports minority engineering outreach organizations andExxonMobil is the lead supportera member of the National Action CouncilWomen’s Leadership Board at Harvard University and committed $1.5 million in 2008 to Harvard’s “Closing the Gender Gap” research program, in addition to supporting research at the International Center for MinoritiesResearch on Women. ExxonMobil also launched, in Engineering,2008, a mentoring program to link successful women leaders at Fortune 500 companies with high potential female students at local universities.
ExxonMobil continues to be the largest privately funded sourcecontributor to the Society of minority student scholarshipsWomen Engineers for outreach programs to young women, having provided $2.2 million in the U.S.past 10 years. In addition ExxonMobil provided a $1 million, five-year grant to Spelman College and Georgia Tech in 2006 to develop African-American women engineers through the Women in Science and Engineering (WISE) Program.
ExxonMobil has a long history of supporting organizations that help improve career opportunities for women and under-represented groups, with specific focus on the sciences, technology, engineering, and mathematics. Continuing its effort to spur more student interest in math and science, the ExxonMobil Foundation donated $1 million to the Society of Women Engineers. This will support career guidance materials and program outreach activities to help increase the number of women in engineering.
The Company will continue to communicate about its diversity efforts through theCorporate Citizenship Report and on the Company’s Web site.
ITEM 11 – POLITICAL CONTRIBUTIONS REPORT
This proposal was submitted by Ms. Tracy Burt, 467 Alvarado Street, San Francisco, CA 94114, as lead proponent of a filing group.
“Resolved, that the shareholders of ExxonMobil hereby request that the Company provide a report, updated semi-annually, disclosing ExxonMobil’s:
The report shall be presented to the board of directors’ audit committee or other relevant oversight committee and posted on the company’s website to reduce costs to shareholders.
Supporting Statement
As long-term shareholders of ExxonMobil, we support transparency and accountability in corporate spending on political activities. These activities include direct and indirect political contributions to candidates, political parties or political organizations; independent expenditures; or electioneering communications on behalf of a federal, state or local candidate.
Disclosure is consistent with public policy and in the best interest of the company and its shareholders. Absent a system of accountability, company assets can be used for policy objectives that may be inimical to long-term interests of and may pose risks to our company and its shareholders.
ExxonMobil contributed at least $470,000 and possibly more in corporate funds since the 2002 election cycle. (http://www.politicalaccountability.net/content.asp?contentid=418) However, its payments to trade associations used for political activities are undisclosed and unknown.
Trade Associations engage in political activities that may adversely impact the long-term interests of the company and its shareholders and the company’s reputation. A critical issue is global warming which can have serious consequences for our company. For example, ExxonMobil is a member of the National Association of Manufacturers, which continues to take an outspoken position denying the existence of
scientific consensus on global warming and opposing government action. Without disclosure, it is impossible for shareholders to know about payments to trade associations and how they are used by associations for political activities, including those opposing government action on global warming.
Relying on publicly available data does not provide a complete picture of political expenditures. ExxonMobil’s Board and shareholders need complete disclosure to be able to fully evaluate the political use of corporate assets. Thus, we urge your support for this critical governance reform.”
The Board recommends you vote AGAINST this proposal for the following reasons:
The Board believes the adoption of this proposal is unnecessary, as an itemized listing of corporate contributions to candidates for public office and to political organizations known as “527s” at the state level is already posted on our Web site atexxonmobil.com/politicaland is updated annually.
It is the Corporation’s policy to communicate information and views on issues of public concern that have an important impact on the Corporation and our shareholders. The Corporation’s policy on political activities is incorporated in ourStandards of Business Conductand available on our Web site. All political contributions are consistently reported to governing agencies as and when required by law.
ExxonMobil’s business rationale for making political contributions is to contribute to candidates and organizations that favor the strengthening of the free enterprise system and hold views consistent with the best interests of the Corporation.
It is the policy of Exxon Mobil Corporation to make contributions to political candidates and political parties only as permitted by applicable laws and authorized by the Board of Directors. ExxonMobil makes limited political contributions with corporate funds in a small number of states in the United States where such contributions are legal. The Corporation also makes limited contributions to political organizations commonly known as “527s.”
All corporate political contributions are approved by the Vice President for Public Affairs and the Chairman of the Board. The Vice President for Public Affairs reports to the Board of Directors on political contributions on an annual basis. The guidelines on political activities are also posted on our Web site.
The Corporation maintains memberships with a variety of trade associations. Under the Internal Revenue Code, the extent to which these associations engage in political activities is disclosed to the IRS by the associations. Itemization of membership dues by the Corporation would increase competition among the trade associations for funding.
ITEM 1210 – AMENDMENT OF EEO POLICY
This proposal was submitted by the New York City Employees’ Retirement System, 1 Centre Street, New York, NY 10007, as lead proponent of a filing group.
“Whereas:ExxonMobilExxon Mobil Corporation does not explicitly prohibit discrimination based on sexual orientation and gender identity in its written employment policy;
Over 88% of the Fortune 500 companies have adopted written nondiscrimination policies prohibiting harassment and discrimination on the basis of sexual orientation, as have more than 98% of Fortune 100 companies, according to the Human Rights Campaign; over 30% now prohibit discrimination based on gender identity;
We believe that corporations that prohibit discrimination on the basis of sexual orientation and gender identity have a competitive advantage in recruiting and retaining employees from the widest talent pool;
According to a September 2002June, 2008 survey by Harris Interactive and Witeck-Combs, 41%65% of gay and lesbian workers in the United States reported an experience withfacing some form of job discrimination related to sexual orientation; an earlier survey found that almost one out of every 10 gay or lesbian adults also statedreported that they had been fired or dismissed unfairly from a previous job, or pressured to quit a job because of their sexual orientation;
Twenty states, the District of Columbia and more than 160 cities and counties, have laws prohibiting employment discrimination based on sexual orientation; 12 states and the District of Columbia have laws prohibiting employment discrimination based on sexual orientation and gender identity;
Minneapolis, San Francisco, Seattle and Los Angeles have adopted legislation restricting business with companies that do not guarantee equal treatment for gay and lesbian employees;
Seventeen states, the District of Columbia and more than 160 cities and counties, including the city of Dallas, have laws prohibiting employment discrimination based on sexual orientation;
Our company has operations in, and makes sales to institutions in states and cities that prohibit discrimination on the basis of sexual orientation;
National public opinion polls consistently find more than three quarters of the American people support equal rights in the workplace for gay men, lesbians and bisexuals; for example, in a Gallup poll conducted in March, 2003, 88%May, 2007, 89% of respondents favored equal opportunity in employment for gays and lesbians;
Resolved: The Shareholders request that ExxonMobilExxon Mobil Corporation amend its written equal employment opportunity policy to explicitly prohibit discrimination based on sexual orientation and gender identity and to substantially implement the policy.
Supporting Statement: Employment discrimination on the basis of sexual orientation and gender identity diminishes employee morale and productivity. Because state and local laws are inconsistent with respect to employment discrimination, our company would benefit from a consistent, corporate wide policy to enhance efforts to prevent discrimination, resolve complaints internally, and ensure a respectful and supportive atmosphere for all employees. ExxonMobilExxon Mobil Corporation will enhance its competitive edge by joining the growing ranks of companies guaranteeing equal opportunity for all employees.”
The Board recommends you vote AGAINST this proposal for the following reasons:
ExxonMobil is committed to having a workplace that facilitates the maximum contribution from all of our employees. While there are many factors that are important to creating this type of environment, one of the most significant is having a workplace that is free from any form of harassment or discrimination.
The Board has reviewed in detail ExxonMobil’s existing global policies that prohibit all forms of discrimination, including those based on sexual orientation and gender identity, in any Company
workplace, anywhere in the world. In fact ExxonMobil’s policies go beyond the law and prohibit any form of discrimination. Based on these existing all-inclusive, zero-tolerance policies, the Board does not support this proposal.believes the proposal is unnecessary.
The Corporation’s Equal Employment Opportunity (EEO) and Harassment in the Workplace policies, which are included in theStandards of Business Conduct (Standards), constitute the foundational documents of our employment non-discriminationnondiscrimination policy. The EEO communication initiatives, training programs, and investigating and stewardship processes explicitly state that any form of discrimination or harassment in the workplace based on sexual orientation will not be tolerated, and more broadly, that no form of discrimination or harassment in the workplace will be tolerated. It is these elements, as a totality, that constitute ExxonMobil’s policies.
As stated in the EEO portion of theStandards,the Corporation administers its personnel policies, programs, and practices in a non-discriminatorynondiscriminatory manner in all aspects of the employment relationship, including recruitment, hiring, work assignment, promotion, transfer, termination, wage and salary administration, and selection for training. ExxonMobil is a meritocracy, with programs and policies designed to employ the best people, recognize and reward superior job performance, and to create an environment in which employees can maximize their contributions and reach their full potential. A discrimination-free environment is essential to meet these objectives.
Where we operate in countries in which the national laws require specific language regarding nondiscrimination based on sexual orientation or gender identity be included in policies, we have amended our policies as appropriate.
SUPPORTING STATEMENT Exxon is managed by its Board of Further, aA written statement by our Chairman regarding ExxonMobil’s commitment to non-discriminationnondiscrimination, including that based on the basis of sexual orientation, is widely accessible to all employees on the Company intranet, and we provide training programs for new employees and refresher courses for existing employees. The harassment training material included in ourWorking Together booklet includes an example specifically based on sexual orientation. Finally, as a partour ongoing policy compliance stewardship, ExxonMobil also has annual reporting and compliance procedures, which include a letterDirectors. Much power is delegated to all senior
managers emphasizing their responsibilities regarding maintaining work environments free from harassment and discrimination.
ITEM 13 – COMMUNITY ENVIRONMENTAL IMPACT
This proposal was submitted by The Episcopal Church, 815 Second Avenue, New York, NY 10017, as lead proponent of a filing group.
“Resolved:
Shareholders request thatthe CEO, but it’s the Board that must take the initiative, and function independently, in some of Directors report, at reasonable cost and omitting proprietary information, on how the corporation ensures thatmost important matters affecting the company. In our view, it is accountabledifficult for its environmental impactsa board of 11 individuals to do so without some one individual charged with the responsibility of making it all work.
Exxon has a ‘lead director,’ Samuel Palmisano, the Chairman and chief executive of IBM. We hold him in high regard. However, we believe it unrealistic to think that a man with as demanding a job as running IBM could at the same time have the time to lead a board in managing Exxon and make it a top priority.
We therefore favor the concept of an independent nonexecutive chairman. The concept is neither new nor novel. Exxon’s principal worldwide competitors – British Petroleum, Royal Dutch Shell, Petrobras – all have independent nonexecutive chairmen.
The nonexecutive chairman does not merely preside at directors’ meetings. He directs the administration of all the Board’s activities. He is not an executive officer; but, by virtue of his time commitment and independent access, he is in a position to inform himself as to what in fact is going on and bring to the Board’s attention matters on which it should focus. He speaks for the Board and is available to those legitimately wishing to have contact with the Board.
It is sometimes argued that a company must speak with one voice. But the CEO/nonexecutive chairman model has been around for a long time and, in our view, has worked rather well. We believe shareholders wish to hear not only the voice of the communities where it operates. The report should containCEO but the following information:
Supporting statement
ExxonMobil ranks 6th on a list of worst U.S. corporate polluters in termsvoice of the amountBoard as well.
Our proposal is not intended as any implied criticism. However, even big companies can experience great difficulties, as recent events demonstrate, and toxicity of pollution, andquestions are then raised whether the numbers of people exposeddirectors should have exercised greater oversight. Our proposal is intended to it (based on 2002 toxics data).http://www.peri.umass.edu/Toxic-100-Table.265.0.html
Most of this pollution is from ExxonMobil’s refinery operations. ExxonMobil’s refineryprovide a framework that, in Baton Rouge, LA, isour view, will enable the second largest emitter of toxic pollutants among all U.S. EPA regulated refineries. Its Joliet, IL, refinery is the largest source of toxic air and water emissions in that state.
ExxonMobil has come under scrutiny for a January 2006 release of process gas from its Baytown, TX, refinery (Houston Chronicle3/26/06) and for lax security at its Chalmette, LA, refinery where enough hydrofluoric acid is stored to put the population of New Orleans at risk. (NY Times5/22/05)
In October 2005, ExxonMobil agreed to pay $571 million to install pollution control technologies at seven of its refineries in settlement of EPA claims of federal Clean Air Act violations. ExxonMobil was also required to pay $8.7 in fines and $9.7 million on supplemental environmental projects.
Refineries account for 5 percent of the country’s dangerous air pollution. As a former EPA official explained, refinery pollution affects local communities more than power plants because it is released from short smokestacks and does not dissipate readily. ‘People are living cheek by jowl with refinery pollution.’ (Washington Post 1/28/05)http://www.washingtonpost.com/wp-dyn/articles/A43014-005Jan27.html?referrer=email
Corporations have a moral responsibilityBoard to be accountable for their environmental impacts – not just effects on the entire ecosystem, but also direct effects on the communities that host their facilities. Communities are often the forgotten stakeholders in terms of corporate activitiesmore effective and impact. No corporation can operate without the resources that local communities provide, but it is often these communities that bear the brunt of corporate activities.proactive.
Also of concern to proponents are the effects of corporate activities on low-income areas and communities of color. Several of the ‘fence-line communities’ near ExxonMobil’s refineries are African American. One study has found that facilities like oil refineries operated in largely African-American counties may ‘pose greater risk of accident and injury than those in counties with fewer African-Americans.’Environmental Justice: Frequency and Severity of U.S. Chemical Industry Accidents and the
Socio-economic Status of Surrounding Communities,58 Journal of Epidemiology and Community Health, 24-30 (2004)For our full statement, please see our website atwww.exxonaction.com.”
The Board recommends you vote AGAINST this proposal for the following reasons:
ExxonMobil is committed to operating in an environmentally responsible manner in every place we do business. The Corporation communicates with shareholders and the public about our environmental performance through theCorporate Citizenship Report(CCR), national reporting systems, and site-based communication processes. The Board believes that the additional report requested bydecision as to who should serve as Chairman and CEO, and whether the offices should be combined or separate, is properly the responsibility of the Board. The members of the Board possess considerable experience and unique knowledge of the challenges and opportunities the Company faces, and are in the best position to evaluate the needs of the Company and how best to organize the capabilities of the directors and senior managers to meet those needs. The Board believes that the most effective leadership structure for Exxon Mobil Corporation at the present time is for Mr. Tillerson to serve as both Chairman and CEO.
The Board believes there is NO single best organizational model that is the most effective in all circumstances, and the Board retains the authority to separate the positions of Chairman and CEO if it deems appropriate in the future. This proposal, however, which is structured this year as a binding, prescriptive By-Law amendment, would cause the Board to lose its flexibility to change the structure of the Chairman and CEO positions, as and when appropriate, to best serve the interests of shareholders. We also believe the proposal would create practical difficulties. Accordingly the Board does not support this proposal.
To demonstrate its continuing commitment to strong corporate governance and Board independence, the Board took steps in 2008 to enhance the role of the Presiding Director. With these changes, the independent members of the Board will annually select one of their members to serve as Presiding Director. It is normally expected that the same director will serve as Presiding Director for a minimum of two years. The Presiding Director will act as a liaison with the Chairman, in consultation with the other directors, provided that each director will also be duplicative to information already availableafforded direct and complete access to the public.
ExxonMobil’s Environmental Policy clearly states the Company will comply with all applicable laws and regulations and apply responsible standards where laws do not exist. Assessments of performance are conductedChairman at each site via the Operations Integrity Management System, which includes environmental performance expectations and is fully compliant with the International Organization for Standardization’s standard for environmental management systems (ISO 14001).
ExxonMobil has had detailed guidelines in place since 1998 for the assessment of environmental aspects and mitigation of potential impacts. In 2007, the Company revised this Environmental Aspects Guideline to enable more comprehensive identification and risk-based assessments of environmental impacts. These assessments provide input to our Environmental Business Plans, which are utilized by all sites to systematically identify key environmental drivers, set targets in key focus areas, and identify projects and actions to achieve those targets.
For example, we have reduced our air emissionsany time as such as sulfur dioxide, nitrogen oxides (NOx), and volatile organic compounds (VOC) by 11 to 20 percent from 2003 to 2006. In addition, since the launch of our Global Energy Management System in 2000, we have identified opportunities to improve energy efficiency of our refineries and chemical plants by 15 to 20 percent. More than 50 percent of these opportunities have been captured. For example, through actions taken in 2006 and 2007 we reduced GHG emissions by about 5 million metric tons in 2007, equivalent to removing about one million cars from U.S. roads. In 2007, our Baton Rouge Refinery was presented the EnergyStar Award by the U.S. Environmental Protection Agency in recognition of the facility’s industry-leading improvements in energy efficient operations. This refinery has reduced VOCs by 72 percent and NOx by 31 percent compared to 1990, and reduced flaring by 69 percent compared to 2004.
An integral step in assessing and mitigating potential environmental impacts is the ability to accurately monitor emissions. ExxonMobil has been active in the development and application of Leak Detection and Repair, and air and water monitoring technologies enabling significant reductions in fugitive emissions across our operations, such as the 72-percent reduction in fugitive emissions from equipment at the Baton Rouge Refinery since 2000.
ExxonMobil is committed to ongoing engagement with communities in which we operate. The Corporation has implemented globally Best Practices in External Affairs (BPEA), our primary management system for external affairs. BPEA is a strategic planning and management tool that teaches and encourages ExxonMobil affiliates to seek and practice excellence in community relationships at every level. During the life of a projectdirector deems necessary or facility, we meet regularly with community leaders, community associations, and nongovernmental organizations that are interested in our operations. This helps us better understand the viewpoints and concerns of the diverse communities in which we operate, and provides us with an opportunity to share information on operational processes, environmental safeguards, and future plans. At many sites, these relationships have been formalized through Citizen Advisory Panels that meet routinely with facility management.
Through theCCR, available on our Web site atexxonmobil.com/citizenship, the Company reports on key Environmental Performance Indicators consistent with the published International Petroleum Industry Environmental Conservation Association Guidelines, including air emissions, spills, and hydrocarbon to water. The Company participates in numerous publicly available national reporting systems, such as the European Pollutant Emission Register, U.S. Toxics Release Inventory, and Japanese Pollutant Release andappropriate.
Transfer Register. Further, manySpecific duties of our affiliatesthe Presiding Director include chairing executive sessions of the non-employee directors and operating facilities produce citizenship reportsproviding feedback from such sessions to the Chairman, and chairing meetings of the Board in the absence of the Chairman and President. In addition the Presiding Director reviews in advance, in consultation with the Chairman, the schedule and agenda for all Board meetings as well as materials distributed to the directors in connection therewith.
Executive sessions of the non-employee directors are scheduled to follow each meeting of the full Board. If the Board includes non-employee directors who are not independent, at least one executive session per year will include only the independent directors. Additional executive sessions may be convened by the Presiding Director at his or community newsletters to communicate site-specific information locally.
ExxonMobil has donated over $100 million to communityher discretion and social development programs, and over $75 million to health and environmental programs since 2000. The Company supports research to understand the impacts of air quality on health including supportwill be convened if requested by any other director. Any non-employee director may raise issues for the Mickey Leland National Air Toxics Research Center and The National Environmental Respiratory Center.discussion at an executive session.
ITEM 147 – ANWR DRILLING REPORTSHAREHOLDER ADVISORY VOTE ON EXECUTIVE COMPENSATION
This proposal was submitted by Green Century Capital Management, 114 StateThe Needmor Fund, 3306 NW 71st Street, Suite 200, Boston, MA 02109,Seattle, WA 98117, as lead proponent of a filing group.
“WHEREAS:RESOLVED, that shareholders of ExxonMobil request the Arctic National Wildlife Refuge isboard of directors to adopt a policy that provides shareholders the only conservation areaopportunity at each annual shareholder meeting to vote on an advisory resolution, proposed by management, to ratify the compensation of the named executive officers (‘NEOs’) set forth in the nationproxy statement’s Summary Compensation Table (the ‘SCT’) and the accompanying narrative disclosure of material factors provided to understand the SCT (but not the Compensation Discussion and Analysis). The proposal submitted to shareholders should make clear that providesthe vote is non-binding and would not affect any compensation paid or awarded to any NEO.
SUPPORTING STATEMENT
Investors are increasingly concerned about mushrooming executive compensation especially when it is insufficiently linked to performance. In 2008, shareholders filed close to 100 ‘Say on Pay’ resolutions. Votes on these resolutions have averaged 43% in favor, including 40.8% at ExxonMobil, with ten votes over 50%, demonstrating strong shareholder support for this reform.
An Advisory Vote establishes an annual referendum process for shareholders about senior executive compensation. We believe the results of this vote would provide the board and management useful information about shareholder views on the company’s senior executive compensation.
In its 2008 proxy Aflac submitted an Advisory Vote resulting in a complete range93% vote in favor, indicating strong investor support for good disclosure and a reasonable compensation package. Daniel Amos, Chairman and CEO said, ‘An advisory vote on our compensation report is a helpful avenue for our shareholders to provide feedback on our pay-for-performance compensation philosophy and pay package.’
To date eight other companies have also agreed to an Advisory Vote, including Verizon, MBIA, H&R Block, Blockbuster, and Tech Data. TIAA-CREF, the country’s largest pension fund, has successfully utilized the Advisory Vote twice.
Influential proxy voting service RiskMetrics Group, recommends votes in favor, noting: ‘RiskMetrics encourages companies to allow shareholders to express their opinions of Arctic and sub-Arctic ecosystems balanced with a wide variety of wildlife, including large populations of caribou, musk oxen, polar bears, snow geese and 180 species of other migratory birds;executive compensation practices by establishing an annual referendum process. An advisory vote on executive compensation is another step forward in enhancing board accountability.’
The Council of Institutional Investors endorsed advisory votes and a bill to allow annual advisory votes passed the House of Representatives by a 2-to-1 margin. As presidential candidates, Senators Obama and McCain supported the Advisory Vote.
We believe that existing U.S. FishSecurities and Wildlife Service considers the Arctic Refuge one of the finest examples of wilderness leftExchange Commission rules and stock exchange listing standards do not provide shareholders with sufficient mechanisms for providing input to boards on the planet;
The coastal plain of the Arctic Refuge is the only section of Alaska’s entire North Slope not open for oil and gas leasing, exploration and production;
RESOLVED, the Shareholders request that Board of Directors prepare a report, at reasonable cost and omitting proprietary information, on the potential environmental damage that would result from the company drilling for oil and gas in the coastal plain of the Arctic National Wildlife Refuge. The report should consider the implications of a policy of refraining from drilling in this area.
Supporting Statement
‘Ninety-five percent of Alaska’s most promising oil-bearing lands are already open for development, but it is imperative that we continue to protect the wildlife, fish and wilderness that make up the rest of this invaluable part of our American heritage.’ – President Jimmy Carter (1995)
Once part of the largest intact wilderness areasenior executive compensation. In contrast, in the United States, the North Slope now hosts one of the world’s largest industrial complexes. In fact, oilKingdom, public companies already have accessallow shareholders to an overwhelming majority of Alaska’s North Slope. More than 1500 miles of roads and pipelines and thousands of acres of industrial facilities sprawl over some 400 square miles of once pristine arctic tundra. Oil operations on the North Slope annually emit roughly 43,000 tons of nitrogen oxides and 100,000 metric tons of methane, emissions that contribute to smog, acid rain, and global warming.
The coastal plain is the biological heart of the Refuge, to which the vast Porcupine River caribou herd migrates each spring to give birth. The Department of Interior has concluded that development in the coastal plain would result in major adverse impacts on the caribou population. According to biologists from the Alaska Department of Fish and Game caribou inhabiting the oil fields do not thrive as well as members of the same herd that seldom encounter oil-related facilities.
The coastal plain is also the most important onshore denning area for the entire South Beaufort Sea polar bear population, and serves as crucial habitat for musk oxen and for at least 180 bird species that gather there for breeding, nesting and migratory activities.
Balanced against these priceless resources is the small potential for economically recoverable oil in the coastal plain. In fact, the most recent federal estimate predicted that only 3.2 billion barrels would be economically recoverable in the coastal plain – less than 6 months worth of oil for the United States.
Vote YES for this proposal, which will improve our Company’s reputation as a leader in environmentally responsible energy recovery.”cast
The Board recommends youa vote AGAINST this proposal foron the following reasons:‘directors’ remuneration report,’ which discloses executive compensation. Such a vote isn’t binding, but gives shareholders a clear voice that could help shape senior executive compensation.
This proposal is essentially the same as proposals submitted for the ExxonMobil annual meetings in 2000, 2001,We believe that a company that has a clearly explained compensation philosophy and 2002. More than 90 percent of the votes cast by shareholders in these years were AGAINST this proposal. Given the uncertainties about timingmetrics, reasonably links pay to performance, and content of potential changes in the federal regulations prohibiting Arctic National Wildlife Refuge (ANWR) development, the Board believes preparation ofcommunicates effectively to investors would find a report onmanagement sponsored Advisory Vote a hypothetical drilling program would be a waste of Company resources.helpful tool.
Oil and gas exploration and development in ANWR is currently prohibited by federal regulations. ANWR encompasses 19 million acres, of which the Coastal Plain is about 1.5 million acres. The U.S. Department of Interior estimates the Coastal Plain could contain between 9 and 16 billion barrels of recoverable oil. ExxonMobil has no property interests or rights to acquire property interests or drilling rights in the Coastal Plain. However, if the federal government choseWe urge our board to allow exploration and development, the Company might pursue those opportunities.
ExxonMobil supports environmentally responsible exploration and development within the Coastal Plain of ANWR. Technological and environmental protection developments across the industry have demonstrated the abilityshareholders to develop oil and gas reserves in environmentally sensitive areas by minimizing surface disruption and facilities, and implementing reasonable protection measures. ExxonMobil’s Sakhalin development in eastern Russia isexpress their opinion about senior executive compensation through an example of this ability.Advisory Vote.”
ExxonMobil has Environmental Aspects Guidelines in place to enable comprehensive identification and risk-based assessment of potential environmental impacts. These assessments provide input to our Environmental Business Planning processes which systematically identify key environmental drivers, set targets in key focus areas, and identify projects and actions to achieve those targets.
ITEM 15 – GREENHOUSE GAS EMISSIONS GOALS
This proposal was submitted by the Sisters of St. Dominic of Caldwell New Jersey, 40 South Fullerton Avenue, Montclair, NJ 07042, as lead proponent of a filing group.
“WHEREAS:
The International Energy Agency warned in its 2007 World Energy Outlook that ‘urgent action is needed if greenhouse gas [GHG] concentrations are to be stabilized at a level that would prevent dangerous interference with the climate system.’
ExxonMobil operates in countries that have ratified the Kyoto Protocol, obliging them to reduce GHG emissions below 1990 levels by 2012. Yet Kyoto targets may be inadequate to avert the most serious impacts of global warming. Dozens of companies, including competitors ConocoPhillips, BP America, and Shell, have endorsed calls for the US to reduce carbon emissions by 60-80% by 2050. 150 global corporations have called on world leaders to finalize a comprehensive, binding UN framework to tackle climate change, urging already industrialized nations to make the greatest efforts (11/30/07).
ExxonMobil has minimally invested in cogeneration, improved energy efficiency in refineries, reduced gas flaring, and supported climate research. For five years, ExxonMobil has stressed its donation to Stanford University’s Global Climate and Energy Project, and its partnerships with Toyota and Caterpillar on advanced fuels and engines, yet shareholders are given little information on progress or outcomes regarding these initiatives.
ExxonMobil has identified opportunities to increase operational energy efficiency by 15-20%, yet has implemented only half of these, missing potential savings of $750 million per year (Carbon Disclosure Project 5). ExxonMobil’s global energy costs for 2006 totaled $10 billion, equal to 1,475 trillion BTUs of energy.
Despite its well-publicized efforts, ExxonMobil’s global CO2 emissions increased from 2003 to 2006 – absolute operational emissions were 145.5 million metric tons in 2006, a 5.4% increase since 2005 (CDP5).
BP, Shell, ConocoPhillips, and Chevron each have significant commitments to investments in renewables, low-carbon technologies to reduce emissions, integration of the cost of carbon into strategic planning and investments, and compensation incentives for climate performance. These commitments have already enabled competitors to: secure positions in specific alternative energy markets, deliver emissions reductions, prepare for regulatory requirements, and raise their credibility in public policy debates.
Shifts in consumer preference, coupled with emissions regulations and sustained high oil prices, could significantly alter ExxonMobil’s market assumptions for the next 30 years. A March 2007 Credit Suisse report notes: ‘An increase in the efficiency of energy consumption and in the amount of renewable electricity production will likely lower long-term future demand growth for both oil and gas relative to current expectations.’
Proponents are concerned that ExxonMobil’s business plan appears to consider few scenarios that incorporate a decline in these markets due to forthcoming regulations and incentives, or governments’ need to stabilize global GHG emissions because of the physical risks they pose.
THEREFORE, BE IT RESOLVED: shareholders request that the Board of Directors adopt quantitative goals, based on current technologies, for reducing total greenhouse gas emissions from the Company’s products and operations; and that the Company report to shareholders by September 30, 2008, on its plans to achieve these goals. Such a report will omit proprietary information and be prepared at reasonable cost.”
The Board recommends you vote AGAINST this proposal for the following reasons:
At ExxonMobil, we take the risk posed by rising greenhouse gas (GHG) emissions seriously and are taking action. Our views, actions, and progress on climate change are widely available, for example, in executive speeches, in the reportTomorrow’s Energy: A Perspective on Energy Trends, Greenhouse Gas Emissions and Future Energy Options (2006), in our report to theCarbon Disclosure Project (2007), and in the annualCorporate Citizenship Report. While investing to increase production, our scientists and engineers are diligently seeking opportunities to improve efficiency and reduce emissions while maintaining leadership in returns to shareholders. As well, the Company will comply with emerging laws and regulations concerning GHG emissions.
In pursuing its business objectives on behalf of shareholders and in meeting society’s aspirations for a better future, ExxonMobil seeks to increase oil and natural gas production to meet rising global demand. The primary opportunities for reducing greenhouse gas emissions from the Company’s operations are in improving energy efficiency and in reducing flaring. In both areas, the Company’s operations have improvement objectives and planned improvement steps that will offset some of the growth associated with higher production and more energy-intensive operations. For example, through actions taken in 2006 and 2007, we reduced GHG emissions by about 5 million metric tons in 2007, equivalent to removing about one million cars from U.S. roads. In Nigeria, we are investing about $3 billion on projects to effectively eliminate routine gas flaring in our operations there. In addition, as part of the American Petroleum Institute’s Climate Change Program, ExxonMobil committed to improve energy efficiency by 10 percent between 2002 and 2012 across U.S. refining operations. We are on pace to exceed that commitment, not only in the U.S., but globally as well.
GHG emissions from ExxonMobil’s customers’ use of its products are determined both by the need for energy and by the efficiency with which the energy is consumed. The Company has active research efforts under way to identify technologies that can improve the efficiency of the use of its products. For example, in the past year, ExxonMobil announced the development of a new technology for on-board hydrogen reforming to power fuel cell vehicles, as well as the deployment of new battery separator films for use in lithium-ion batteries in hybrid and electric vehicles. Both of these technologies demonstrate significant potential to reduce emissions from transport.
Besides efficiency gains, another step to reduce GHG emissions involves more widespread use of natural gas, rather than coal, to produce electric power – an area in which ExxonMobil is well-positioned to enhance supplies. Another means to reduce GHG emissions is carbon capture and storage. We have
been involved in the development and utilization of this technology in our own oil and gas operations and in partnership with others for over three decades. In 2006, we agreed to participate in a ground-breaking research initiative sponsored by the European Commission called “CO2ReMoVe” to establish scientific monitoring standards and determine the reliability of geological CO2 storage.
Beyond efforts to reduce emissions from our own operations and products, ExxonMobil has also worked to establish and is providing $100 million to Stanford University’s long-term Global Climate and Energy Project (GCEP). GCEP is a pioneering research effort aimed at innovation across a broad portfolio of technology areas that can lower GHG emissions on a worldwide scale. Results and progress are available on the GCEP Web site.
ITEM 16 – CO2 INFORMATION AT THE PUMP
This proposal was submitted by Mr. Mario Lalanne, 19 chemin de Casson, Westmount, Quebec, Canada H3Y 2G9.
“Resolved that Exxon Mobil Corporation inform its customers about the carbon dioxide (CO2) emissions generated by the gasoline or the diesel fuel they buy. The quantitative information would be provided at the pump and based on average well-to-wheels figures, i. e. encompassing all phases from extraction up to and including consumption.
SUPPORTING STATEMENT:
|
|
The Board recommends you vote AGAINST this proposal for the following reasons:
The Board agrees that input from shareholders should play an important role in the design of executive compensation programs. Accordingly the Board has already put in place a thorough, thoughtful, and transparent approach to executive compensation – including a number of effective ways for shareholders to express their views on these matters. The Board does not believe the advisory vote suggested by the proponent would be helpful or effective for this purpose.
As described in detail in the “Compensation Discussion and Analysis” and accompanying tables in this proxy statement, ExxonMobil’s executive compensation program consists of a number of elements carefully designed to support ExxonMobil’s specific circumstances and business goals. A simple up or down vote on this program would not convey useful information to the Board as to the specific element of the program with which a shareholder may have a concern or the nature of that consumer labelingconcern.
We also believe widespread adoption of the advisory vote on compensation would have the negative effect of encouraging companies to take a “one size fits all” approach to compensation under which programs would be designed with reference to standardized voting guidelines of proxy advisory firms, rather than to the particular facts and circumstances of the business.
From a practical standpoint, shareholders are not able to review the full range of information concerning a company – including information on business strategy and outlook, competitive positioning, corporate culture, and employee performance – taken into account by the Board in making executive compensation decisions. Substituting the judgment of shareholders for the judgment of the Board on these matters would result in a less-informed decision-making process, and would circumvent the role of the Board in representing shareholders – a role that has been fundamental to the long-term success and competitive advantage of ExxonMobil.
The Board and management recognize the importance of improving the public’s understanding of ExxonMobil’s executive compensation program, addressing disclosure issues, and improving shareholder involvement. Public awareness and understanding are essential; therefore, changes continue to be made to the “Compensation Discussion and Analysis” section in this proxy statement to improve knowledge of how executive compensation links to and supports the business strategies and long-term success of the Company. The “Compensation Discussion and Analysis” includes a conceptual model and summary description to illustrate how business and people strategies are fully integrated to achieve superior results and create shareholder value.
We believe the Company’s approach to executive compensation and the existing communication channels provide shareholders the ability to share input directly with the Board on specific concerns relating to compensation. Shareholders who wish to express their views to the Board have several effective ways to do so – all of which are considerably clearer, and, therefore, more effective than an up or down advisory vote. Shareholders can:
| Ÿ | Write to any Board member or group of Board members and describe their views specifically on executive compensation or on any other material matter; |
| Ÿ | E-mail any Board member or group of Board members through the communication portal on the Company’s Web site; |
| Ÿ | Write or e-mail Company management representatives and discuss specific concerns with the appropriate department managers and/or staff; and, |
| Ÿ | Attend the annual meeting of shareholders and express their views in that forum. |
ITEM 8 – EXECUTIVE COMPENSATION REPORT
This proposal was submitted by NorthStar Asset Management Inc., 43 St. John Street, Jamaica Plain, MA 02130.
“WHEREAS, in 2007, the total compensation of our CEO Rex Tillerson exceeded $16 million including salary, bonus, restricted stock, and the value of his stock awards. In addition, SEC filings report that he holds stock options valued at an additional $16 million and has pension benefits valued at over $24 million;
In 1980, CEOs in the pumpUS were paid 40 times the average worker. Today, they are paid 344 times more.
Last year, Mr. Tillerson was paid 541 times the average worker. This type of over-compensation is an effective or appropriate wayincreasingly being called into question by consumers, politicians and shareholders, and erodes customer trust and loyalty, potentially negatively affecting shareholder value;
In 2007, ExxonMobil share prices increased by 24%, the total market capitalization of the company increased by $19 billion dollars, and Mr. Tillerson’s compensation increased by 28%.
However, as of December 5, 2008, ExxonMobil’s share price has declined 19% and market capitalization has gone down by $88 billion. Yet, according to address public concerns about climate change or individuals’ contributionsa November 25, 2008 ExxonMobil SEC filing, Mr. Tillerson was awarded a $4 million bonus and 225,000 shares of restricted stock. In addition, Mr. Tillerson will receive a 10% raise for 2009.
Legislation passed by the House of Representatives in April 2007, and currently being considered in the Senate, requires shareholders’ approval of executive compensation packages;
RESOLVED, shareholders request the Board initiate a review of our company’s executive compensation policies and make available, upon request, a report of that review by December 1, 2009 (omitting confidential information and prepared at a reasonable cost). We request the report include:
| 1. | A comparison of the increase in the total compensation package of our CEO between 1998 and 2008 with the increase in the average US per capita income during that same period. |
| 2. | An analysis of changes in the relative size of the gap between the two groups and the rationale justifying this trend. |
Supporting Statement
We believe all ExxonMobil employees work together to greenhouse gas emissions.create value for shareholders and customers. We also believe the company has the ability to increase shareholder value by reinvesting in the whole company, not just a single individual. It is not clear how the company’s executive pay incentives are creating the desired and beneficial effect on shareholder value.”
COThe Board recommends you vote AGAINST this proposal for the following reasons:
The Board believes the compensation information disclosed in the proxy statement, which includes a detailed discussion of our compensation goals and methods, provides information that is more meaningful for shareholders than the analysis that is requested by this proposal.
The basis of ExxonMobil’s compensation program is to compensate each individual, executive or non-executive, at a level that recognizes the individual’s experience, performance, and level of responsibility. Compensation should be competitive with that of persons performing similar jobs at other companies with whom the Company competes for employee talent.
ExxonMobil’s compensation programs are internally aligned, but the Committee does not believe a specific numeric ratio between the increase in the compensation of the CEO and the increase in average U.S. per capita income is meaningful or an appropriate factor for setting compensation.
The “Compensation Discussion and Analysis” section in this proxy statement provides a detailed discussion of our compensation goals and methods.
2ITEM 9 – CORPORATE SPONSORSHIPS REPORT emissions data
This proposal was submitted by Dr. Martha Burk, 323 Morning Sun Trail, Corrales, NM 87048.
“Whereas,
ExxonMobil has a strong antidiscrimination statement, stating:
‘ExxonMobil’s policy on discrimination is clear and straightforward. Our all-inclusive, intentionally broad policy prohibits any form of discrimination or harassment, in any company workplace, anywhere in the world – and this policy applies equally to employees, supervisors, contractors, or anyone else in the company’s employ.’
Yet ExxonMobil’s antidiscrimination policy is not as straightforward regarding company expenditures for sponsorships and executive perks with institutions that don’t comply with the clear intent of its antidiscrimination statement.
ExxonMobil is a lead sponsor of the Masters Golf Tournament, owned by and held at Augusta National Incorporated, an organization that explicitly excludes women from combustionmembership.
Resolved,
Shareholders request the Board of standard fuels, suchDirectors conduct a special review of ExxonMobil’s antidiscrimination statement as gasolineit pertains to corporate sponsorships and executive perks and publish a summary report addressing the following:
| 1) | What company funds are presently expended on corporate sponsorships and executive perks, like country club memberships and entertainment at or in conjunction with institutions that discriminate against groups protected by the company’s antidiscrimination statement? |
| 2) | Would the company sponsor an event held at a venue barring African Americans, Jews or homosexuals from membership? |
| 3) | How is the company’s antidiscrimination statement applied to decisions concerning sponsorships and executive perks? |
The report, prepared at reasonable cost and omitting proprietary information, shall be available to shareholders upon request no later than December 1, 2009.
Supporting Statement
ExxonMobil’s strong antidiscrimination statement demonstrates a commitment to workplace inclusion and opportunity. Failing to apply this statement to corporate sponsorships and executive perks undermines these laudable aspirations. Club memberships are more than about recreation, they are places where important business is conducted. Excluding people from these networking opportunities and decisionmaking venues on the basis of gender, race, religion or diesel,sexual orientation is a discriminatory practice denying equal opportunity.
Would ExxonMobil sponsor an event at a club explicitly barring African Americans or Jews from membership? If the answer is ‘no,’ then why would we sponsor events at institutions that explicitly bar women? ExxonMobil has made public statements that the company draws a distinction between race and gender, which is a harmful message for our employees, customers, and potential investors that the company does not value all of its employees equally. Event sponsorships at venues that discriminate against women also sends a message that gender discrimination is not taken seriously by ExxonMobil.
ExxonMobil has many talented women in high ranking positions. These women should in their own right be able to avail themselves of the networking opportunities that come with club membership, rather than having to be invited into these settings by male colleagues, who because of gender alone are eligible for membership.
Our company rightly extends coverage of its antidiscrimination statement to contractors. Why not also to sponsorships and executive perks purchased with shareholder funds?
Please join us in assuring that the ExxonMobil logo stands for the highest standards of antidiscrimination and vote FOR this proposal.”
The Board recommends you vote AGAINST this proposal for the following reasons:
ExxonMobil prohibits discrimination of any kind in its employment policies everywhere in the world. The Board believes the report requested is unnecessary given ExxonMobil’s nondiscrimination policy.
ExxonMobil’s policies on nondiscrimination are clear and comprehensive. The Company is committed to fostering diversity in the workplace, as well known, readily available,as contributing to organizations that support diversity, especially in the area of education. ExxonMobil is consistently recognized as one of the leading supporters of women- and widely disseminated from public sources. In our 2006minority-owned businesses, in terms of actual business awarded.
ExxonMobil determines which organizations and events to support financially based on an assessment of business needs, fit with corporate social objectives, and overall effectiveness. The Company will continue to communicate about its diversity efforts through theCorporate Citizenship Report and on the Company’s Web site.
In 2005 ExxonMobil launched our Educating Women and Girls Initiative (EWGI). EWGI provides funding and applies the Company’s core business and management expertise to help women and girls realize their full potential. Projects funded by EWGI help reduce barriers to education, give women training to start or improve businesses and nongovernmental organizations, and help women to be catalysts for progress and development in their communities. In 2008 EWGI made grants totaling more than $8 million – bringing cumulative investment to almost $20 million.
In 2008 ExxonMobil continued support for the Centre for Development and Population Activities’ Global Women in Management Program. Two hundred women from 35 countries have now been trained. This Program helps strengthen financial management skills of women managers working in community organizations in developing countries.
Reflecting our commitment to diversity, ExxonMobil supports networks for female, African-American, and Hispanic employees that provide mentoring, coaching, and strategies to enhance personal and professional development.
ExxonMobil is a member of the Women’s Leadership Board at Harvard University and committed $1.5 million in 2008 to Harvard’s “Closing the Gender Gap” research program, in addition to supporting research at the International Center for Research on Women. ExxonMobil also launched, in 2008, a mentoring program to link successful women leaders at Fortune 500 companies with high potential female students at local universities.
ExxonMobil continues to be the largest contributor to the Society of Women Engineers for outreach programs to young women, having provided $2.2 million in the past 10 years. In addition ExxonMobil provided emissions data for gasolinea $1 million, five-year grant to Spelman College and diesel. However, such information does littleGeorgia Tech in 2006 to addressdevelop African-American women engineers through the full range of issues that consumers might wish to consider to assess their contribution to greenhouse gas emissionsWomen in Science and options to address them. These include consumers’ choice of vehicle and practices for commuting and travel. As well, emissions arise from a variety of other choices that consumers make regarding place of residence, housing, appliances, and lifestyle.
ExxonMobil supports and contributes to studies that evaluate the full range of emissions associated with the manufacture and use of petroleum and other fuels for various combinations of existing and advanced fuels and vehicles. Such well-to-wheel studies are complex. In particular, they involve a wide range of inputs and assumptions regarding the original resource, such as crude oil, oil sands, corn, sugar cane, or other biomass; methods of production and refining; and options for vehicles and drive trains. Emissions from well-to-wheels vary considerably – both from well-to-pump, depending on different resources and production options, and from pump-to-wheels, depending on vehicle choice and driving habits.
ExxonMobil provides a range of information on climate issues in various publications and speeches that are readily available on its Web site, particularly the reportTomorrow’s Energy: A Perspective on EnergyEngineering (WISE) Program.
Trends, Greenhouse Gas Emissions and Future Energy Options (2006) and our annualEnergy Outlook. In particular, ExxonMobil supports efforts to improve energy efficiency and has provided information on actions that individuals can take through widely distributed opinion editorials.
ITEM 1710 – CLIMATE CHANGE AND TECHNOLOGY REPORTAMENDMENT OF EEO POLICY
This proposal was submitted by Ms. Neva Rockefeller Goodwin, 30 Rockefeller Plaza, Room 5600,the New York City Employees’ Retirement System, 1 Centre Street, New York, NY 10112,10007, as lead proponent of a filing group.
“Resolved:Shareholders ask Whereas:Exxon Mobil Corporation’s (‘ExxonMobil’s’) BoardCorporation does not explicitly prohibit discrimination based on sexual orientation and gender identity in its written employment policy;
Over 88% of Directors to establish a task force, which should include both (a) two or more independent directorsthe Fortune 500 companies have adopted written nondiscrimination policies prohibiting harassment and (b) relevant company staff, to investigate and report to shareholdersdiscrimination on the likely consequencesbasis of global climate change betweensexual orientation, as have more than 98% of Fortune 100 companies, according to the Human Rights Campaign; over 30% now prohibit discrimination based on gender identity;
We believe that corporations that prohibit discrimination on the basis of sexual orientation and 2030,gender identity have a competitive advantage in recruiting and retaining employees from the widest talent pool;
According to a June, 2008 survey by Harris Interactive and Witeck-Combs, 65% of gay and lesbian workers in the United States reported facing some form of job discrimination related to sexual orientation; an earlier survey found that almost one out of every 10 gay or lesbian adults also reported that they had been fired or dismissed unfairly from a previous job, or pressured to quit a job because of their sexual orientation;
Twenty states, the District of Columbia and more than 160 cities and counties, have laws prohibiting employment discrimination based on sexual orientation; 12 states and the District of Columbia have laws prohibiting employment discrimination based on sexual orientation and gender identity;
Minneapolis, San Francisco, Seattle and Los Angeles have adopted legislation restricting business with companies that do not guarantee equal treatment for emerging countries,gay and poor communitieslesbian employees;
Our company has operations in, these countries and developed countries,makes sales to institutions in states and cities that prohibit discrimination on the basis of sexual orientation;
National public opinion polls consistently find more than three quarters of the American people support equal rights in the workplace for gay men, lesbians and bisexuals; for example, in a Gallup poll conducted in May, 2007, 89% of respondents favored equal opportunity in employment for gays and lesbians;
Resolved: The Shareholders request that Exxon Mobil Corporation amend its written equal employment opportunity policy to explicitly prohibit discrimination based on sexual orientation and gender identity and to comparesubstantially implement the policy.
Supporting Statement: Employment discrimination on the basis of sexual orientation and gender identity diminishes employee morale and productivity. Because state and local laws are inconsistent with respect to employment discrimination, our company would benefit from a consistent, corporate wide policy to enhance efforts to prevent discrimination, resolve complaints internally, and ensure a respectful and supportive atmosphere for all employees. Exxon Mobil Corporation will enhance its competitive edge by joining the growing ranks of companies guaranteeing equal opportunity for all employees.”
The Board recommends you vote AGAINST this proposal for the following reasons:
ExxonMobil is committed to having a workplace that facilitates the maximum contribution from all of our employees. While there are many factors that are important to creating this type of environment, one of the most significant is having a workplace that is free from any form of harassment or discrimination.
The Board has reviewed in detail ExxonMobil’s existing global policies that prohibit all forms of discrimination, including those based on sexual orientation and gender identity, in any Company
workplace, anywhere in the world. In fact ExxonMobil’s policies go beyond the law and prohibit any form of discrimination. Based on these outcomesexisting all-inclusive, zero-tolerance policies, the Board believes the proposal is unnecessary.
The Corporation’s Equal Employment Opportunity (EEO) and Harassment in the Workplace policies, which are included in theStandards of Business Conduct (Standards), constitute the foundational documents of our employment nondiscrimination policy. The EEO communication initiatives, training programs, and investigating and stewardship processes explicitly state that any form of discrimination or harassment in the workplace based on sexual orientation will not be tolerated, and more broadly, that no form of discrimination or harassment in the workplace will be tolerated. It is these elements, as a totality, that constitute ExxonMobil’s policies.
As stated in the EEO portion of theStandards,the Corporation administers its personnel policies, programs, and practices in a nondiscriminatory manner in all aspects of the employment relationship, including recruitment, hiring, work assignment, promotion, transfer, termination, wage and salary administration, and selection for training. ExxonMobil is a meritocracy, with scenariosprograms and policies designed to employ the best people, recognize and reward superior job performance, and to create an environment in which ExxonMobil takes leadershipemployees can maximize their contributions and reach their full potential. A discrimination-free environment is essential to meet these objectives.
Where we operate in developing sustainable energy technologiescountries in which the national laws require specific language regarding nondiscrimination based on sexual orientation or gender identity be included in policies, we have amended our policies as appropriate.
A written statement by our Chairman regarding ExxonMobil’s commitment to nondiscrimination, including that can be used bybased on sexual orientation, is widely accessible to all employees on the Company intranet, and we provide training programs for the benefit of those most threatened by climate change.new employees and refresher courses for existing employees. The report should be prepared at reasonable expense, omitting proprietary information, and should be made available to shareholders by March 31, 2009.
SUPPORTING STATEMENT
Exxon is managed by its Board of Directors. Much power is delegated to the CEO, but it’s the Board that must take the initiative, and function independently, in some of the most important matters affecting the company. In our view, it is difficult for a board of 11 individuals to do so without some one individual charged with the responsibility of making it all work.
Exxon has a ‘lead director,’ Samuel Palmisano, the Chairman and chief executive of IBM. We hold him in high regard. However, we believe it unrealistic to think that a man with as demanding a job as running IBM could at the same time have the time to lead a board in managing Exxon and make it a top priority.
We therefore favor the concept of an independent nonexecutive chairman. The concept is neither new nor novel. Exxon’s principal worldwide competitors – British Petroleum, Royal Dutch Shell, Petrobras – all have independent nonexecutive chairmen.
The nonexecutive chairman does not merely preside at directors’ meetings. He directs the administration of all the Board’s activities. He is not an executive officer; but, by virtue of his time commitment and independent access, he is in a position to inform himself as to what in fact is going on and bring to the Board’s attention matters on which it should focus. He speaks for the Board and is available to those legitimately wishing to have contact with the Board.
It is sometimes argued that a company must speak with one voice. But the CEO/nonexecutive chairman model has been around for a long time and, in our view, has worked rather well. We believe shareholders wish to hear not only the voice of the CEO but the voice of the Board as well.
Our proposal is not intended as any implied criticism. However, even big companies can experience great difficulties, as recent events demonstrate, and questions are then raised whether the directors should have exercised greater oversight. Our proposal is intended to provide a framework that, in our view, will enable the Board to be more effective and proactive.
For our full statement, please see our website atwww.exxonaction.com.”
The Board recommends you vote AGAINST this proposal for the following reasons:
The Board believes that the decision as to who should serve as Chairman and CEO, and whether the offices should be combined or separate, is properly the responsibility of the Board. The members of the Board possess considerable experience and unique knowledge of the challenges and opportunities the Company faces, and are in the best position to evaluate the needs of the Company and how best to organize the capabilities of the directors and senior managers to meet those needs. The Board believes that the most effective leadership structure for Exxon Mobil Corporation at the present time is for Mr. Tillerson to serve as both Chairman and CEO.
The Board believes there is NO single best organizational model that is the most effective in all circumstances, and the Board retains the authority to separate the positions of Chairman and CEO if it deems appropriate in the future. This proposal, however, which is structured this year as a binding, prescriptive By-Law amendment, would cause the Board to lose its flexibility to change the structure of the Chairman and CEO positions, as and when appropriate, to best serve the interests of shareholders. We also believe the proposal would create practical difficulties. Accordingly the Board does not support this proposal.
To demonstrate its continuing commitment to strong corporate governance and Board independence, the Board took steps in 2008 to enhance the role of the Presiding Director. With these changes, the independent members of the Board will annually select one of their members to serve as Presiding Director. It is normally expected that the same director will serve as Presiding Director for a minimum of two years. The Presiding Director will act as a liaison with the Chairman, in consultation with the other directors, provided that each director will also be afforded direct and complete access to the Chairman at any time as such director deems necessary or appropriate.
Specific duties of the Presiding Director include chairing executive sessions of the non-employee directors and providing feedback from such sessions to the Chairman, and chairing meetings of the Board in the absence of the Chairman and President. In addition the Presiding Director reviews in advance, in consultation with the Chairman, the schedule and agenda for all Board meetings as well as materials distributed to the directors in connection therewith.
Executive sessions of the non-employee directors are scheduled to follow each meeting of the full Board. If the Board includes non-employee directors who are not independent, at least one executive session per year will include only the independent directors. Additional executive sessions may be convened by the Presiding Director at his or her discretion and will be convened if requested by any other director. Any non-employee director may raise issues for discussion at an executive session.
ITEM 7 – SHAREHOLDER ADVISORY VOTE ON EXECUTIVE COMPENSATION
This proposal was submitted by The Needmor Fund, 3306 NW 71st Street, Seattle, WA 98117, as lead proponent of a filing group.
“RESOLVED, that shareholders of ExxonMobil request the board of directors to adopt a policy that provides shareholders the opportunity at each annual shareholder meeting to vote on an advisory resolution, proposed by management, to ratify the compensation of the named executive officers (‘NEOs’) set forth in the proxy statement’s Summary Compensation Table (the ‘SCT’) and the accompanying narrative disclosure of material factors provided to understand the SCT (but not the Compensation Discussion and Analysis). The proposal submitted to shareholders should make clear that the vote is non-binding and would not affect any compensation paid or awarded to any NEO.
SUPPORTING STATEMENT
Investors are increasingly concerned about mushrooming executive compensation especially when it is insufficiently linked to performance. In 2008, shareholders filed close to 100 ‘Say on Pay’ resolutions. Votes on these resolutions have averaged 43% in favor, including 40.8% at ExxonMobil, with ten votes over 50%, demonstrating strong shareholder support for this reform.
An Advisory Vote establishes an annual referendum process for shareholders about senior executive compensation. We believe the results of this vote would provide the board and management useful information about shareholder views on the company’s senior executive compensation.
In its 2008 proxy Aflac submitted an Advisory Vote resulting in a 93% vote in favor, indicating strong investor support for good disclosure and a reasonable compensation package. Daniel Amos, Chairman and CEO said, ‘An advisory vote on our compensation report is a helpful avenue for our shareholders to provide feedback on our pay-for-performance compensation philosophy and pay package.’
To date eight other companies have also agreed to an Advisory Vote, including Verizon, MBIA, H&R Block, Blockbuster, and Tech Data. TIAA-CREF, the country’s largest pension fund, has successfully utilized the Advisory Vote twice.
Influential proxy voting service RiskMetrics Group, recommends votes in favor, noting: ‘RiskMetrics encourages companies to allow shareholders to express their opinions of executive compensation practices by establishing an annual referendum process. An advisory vote on executive compensation is another step forward in enhancing board accountability.’
The Council of Institutional Investors endorsed advisory votes and a bill to allow annual advisory votes passed the House of Representatives by a 2-to-1 margin. As presidential candidates, Senators Obama and McCain supported the Advisory Vote.
We believe that existing U.S. Securities and Exchange Commission rules and stock exchange listing standards do not provide shareholders with sufficient mechanisms for providing input to boards on senior executive compensation. In contrast, in the United Kingdom, public companies allow shareholders to cast
a vote on the ‘directors’ remuneration report,’ which discloses executive compensation. Such a vote isn’t binding, but gives shareholders a clear voice that could help shape senior executive compensation.
We believe that a company that has a clearly explained compensation philosophy and metrics, reasonably links pay to performance, and communicates effectively to investors would find a management sponsored Advisory Vote a helpful tool.
We urge our board to allow shareholders to express their opinion about senior executive compensation through an Advisory Vote.”
The Board recommends you vote AGAINST this proposal for the following reasons:
The Board agrees that input from shareholders should play an important role in the design of executive compensation programs. Accordingly the Board has already put in place a thorough, thoughtful, and transparent approach to executive compensation – including a number of effective ways for shareholders to express their views on these matters. The Board does not believe the advisory vote suggested by the proponent would be helpful or effective for this purpose.
As described in detail in the “Compensation Discussion and Analysis” and accompanying tables in this proxy statement, ExxonMobil’s executive compensation program consists of a number of elements carefully designed to support ExxonMobil’s specific circumstances and business goals. A simple up or down vote on this program would not convey useful information to the Board as to the specific element of the program with which a shareholder may have a concern or the nature of that concern.
We also believe widespread adoption of the advisory vote on compensation would have the negative effect of encouraging companies to take a “one size fits all” approach to compensation under which programs would be designed with reference to standardized voting guidelines of proxy advisory firms, rather than to the particular facts and circumstances of the business.
From a practical standpoint, shareholders are not able to review the full range of information concerning a company – including information on business strategy and outlook, competitive positioning, corporate culture, and employee performance – taken into account by the Board in making executive compensation decisions. Substituting the judgment of shareholders for the judgment of the Board on these matters would result in a less-informed decision-making process, and would circumvent the role of the Board in representing shareholders – a role that has been fundamental to the long-term success and competitive advantage of ExxonMobil.
The Board and management recognize the importance of improving the public’s understanding of ExxonMobil’s executive compensation program, addressing disclosure issues, and improving shareholder involvement. Public awareness and understanding are essential; therefore, changes continue to be made to the “Compensation Discussion and Analysis” section in this proxy statement to improve knowledge of how executive compensation links to and supports the business strategies and long-term success of the Company. The “Compensation Discussion and Analysis” includes a conceptual model and summary description to illustrate how business and people strategies are fully integrated to achieve superior results and create shareholder value.
We believe the Company’s approach to executive compensation and the existing communication channels provide shareholders the ability to share input directly with the Board on specific concerns relating to compensation. Shareholders who wish to express their views to the Board have several effective ways to do so – all of which are considerably clearer, and, therefore, more effective than an up or down advisory vote. Shareholders can:
| Ÿ | Write to any Board member or group of Board members and describe their views specifically on executive compensation or on any other material matter; |
| Ÿ | E-mail any Board member or group of Board members through the communication portal on the Company’s Web site; |
| Ÿ | Write or e-mail Company management representatives and discuss specific concerns with the appropriate department managers and/or staff; and, |
| Ÿ | Attend the annual meeting of shareholders and express their views in that forum. |
ITEM 8 – EXECUTIVE COMPENSATION REPORT
This proposal was submitted by NorthStar Asset Management Inc., 43 St. John Street, Jamaica Plain, MA 02130.
“WHEREAS, in 2007, the total compensation of our CEO Rex Tillerson exceeded $16 million including salary, bonus, restricted stock, and the value of his stock awards. In addition, SEC filings report that he holds stock options valued at an additional $16 million and has pension benefits valued at over $24 million;
In 1980, CEOs in the US were paid 40 times the average worker. Today, they are paid 344 times more.
Last year, Mr. Tillerson was paid 541 times the average worker. This type of over-compensation is increasingly being called into question by consumers, politicians and shareholders, and erodes customer trust and loyalty, potentially negatively affecting shareholder value;
In 2007, ExxonMobil share prices increased by 24%, the total market capitalization of the company increased by $19 billion dollars, and Mr. Tillerson’s compensation increased by 28%.
However, as of December 5, 2008, ExxonMobil’s share price has declined 19% and market capitalization has gone down by $88 billion. Yet, according to a November 25, 2008 ExxonMobil SEC filing, Mr. Tillerson was awarded a $4 million bonus and 225,000 shares of restricted stock. In addition, Mr. Tillerson will receive a 10% raise for 2009.
Legislation passed by the House of Representatives in April 2007, and currently being considered in the Senate, requires shareholders’ approval of executive compensation packages;
RESOLVED, shareholders request the Board initiate a review of our company’s executive compensation policies and make available, upon request, a report of that review by December 1, 2009 (omitting confidential information and prepared at a reasonable cost). We request the report include:
| 1. | A comparison of the increase in the total compensation package of our CEO between 1998 and 2008 with the increase in the average US per capita income during that same period. |
| 2. | An analysis of changes in the relative size of the gap between the two groups and the rationale justifying this trend. |
Supporting Statement
We believe all ExxonMobil employees work together to create value for shareholders and customers. We also believe the company has the ability to increase shareholder value by reinvesting in the whole company, not just a single individual. It is not clear how the company’s executive pay incentives are creating the desired and beneficial effect on shareholder value.”
The Board recommends you vote AGAINST this proposal for the following reasons:
The Board believes the compensation information disclosed in the proxy statement, which includes a detailed discussion of our compensation goals and methods, provides information that is more meaningful for shareholders than the analysis that is requested by this proposal.
The basis of ExxonMobil’s compensation program is to compensate each individual, executive or non-executive, at a level that recognizes the individual’s experience, performance, and level of responsibility. Compensation should be competitive with that of persons performing similar jobs at other companies with whom the Company competes for employee talent.
ExxonMobil’s compensation programs are internally aligned, but the Committee does not believe a specific numeric ratio between the increase in the compensation of the CEO and the increase in average U.S. per capita income is meaningful or an appropriate factor for setting compensation.
The “Compensation Discussion and Analysis” section in this proxy statement provides a detailed discussion of our compensation goals and methods.
ITEM 9 – CORPORATE SPONSORSHIPS REPORT
This proposal was submitted by Dr. Martha Burk, 323 Morning Sun Trail, Corrales, NM 87048.
“Whereas,
ExxonMobil has a strong antidiscrimination statement, stating:
‘ExxonMobil’s policy on discrimination is clear and straightforward. Our all-inclusive, intentionally broad policy prohibits any form of discrimination or harassment, in any company workplace, anywhere in the world – and this policy applies equally to employees, supervisors, contractors, or anyone else in the company’s employ.’
Yet ExxonMobil’s antidiscrimination policy is not as straightforward regarding company expenditures for sponsorships and executive perks with institutions that don’t comply with the clear intent of its antidiscrimination statement.
ExxonMobil is a lead sponsor of the Masters Golf Tournament, owned by and held at Augusta National Incorporated, an organization that explicitly excludes women from membership.
Resolved,
Shareholders request the Board of Directors conduct a special review of ExxonMobil’s antidiscrimination statement as it pertains to corporate sponsorships and executive perks and publish a summary report addressing the following:
| 1) | What company funds are presently expended on corporate sponsorships and executive perks, like country club memberships and entertainment at or in conjunction with institutions that discriminate against groups protected by the company’s antidiscrimination statement? |
| 2) | Would the company sponsor an event held at a venue barring African Americans, Jews or homosexuals from membership? |
| 3) | How is the company’s antidiscrimination statement applied to decisions concerning sponsorships and executive perks? |
The report, prepared at reasonable cost and omitting proprietary information, shall be available to shareholders upon request no later than December 1, 2009.
Supporting Statement
ExxonMobil’s strong antidiscrimination statement demonstrates a commitment to workplace inclusion and opportunity. Failing to apply this statement to corporate sponsorships and executive perks undermines these laudable aspirations. Club memberships are more than about recreation, they are places where important business is conducted. Excluding people from these networking opportunities and decisionmaking venues on the basis of gender, race, religion or sexual orientation is a discriminatory practice denying equal opportunity.
Would ExxonMobil sponsor an event at a club explicitly barring African Americans or Jews from membership? If the answer is ‘no,’ then why would we sponsor events at institutions that explicitly bar women? ExxonMobil has made public statements that the company draws a distinction between race and gender, which is a harmful message for our employees, customers, and potential investors that the company does not value all of its employees equally. Event sponsorships at venues that discriminate against women also sends a message that gender discrimination is not taken seriously by ExxonMobil.
ExxonMobil has many talented women in high ranking positions. These women should in their own right be able to avail themselves of the networking opportunities that come with club membership, rather than having to be invited into these settings by male colleagues, who because of gender alone are eligible for membership.
Our company rightly extends coverage of its antidiscrimination statement to contractors. Why not also to sponsorships and executive perks purchased with shareholder funds?
Please join us in assuring that the ExxonMobil logo stands for the highest standards of antidiscrimination and vote FOR this proposal.”
The Board recommends you vote AGAINST this proposal for the following reasons:
ExxonMobil prohibits discrimination of any kind in its employment policies everywhere in the world. The Board believes the report requested is unnecessary given ExxonMobil’s nondiscrimination policy.
ExxonMobil’s policies on nondiscrimination are clear and comprehensive. The Company is committed to fostering diversity in the workplace, as well as contributing to organizations that support diversity, especially in the area of education. ExxonMobil is consistently recognized as one of the leading supporters of women- and minority-owned businesses, in terms of actual business awarded.
ExxonMobil determines which organizations and events to support financially based on an assessment of business needs, fit with corporate social objectives, and overall effectiveness. The Company will continue to communicate about its diversity efforts through theCorporate Citizenship Report and on the Company’s Web site.
In 2005 ExxonMobil launched our Educating Women and Girls Initiative (EWGI). EWGI provides funding and applies the Company’s core business and management expertise to help women and girls realize their full potential. Projects funded by EWGI help reduce barriers to education, give women training to start or improve businesses and nongovernmental organizations, and help women to be catalysts for progress and development in their communities. In 2008 EWGI made grants totaling more than $8 million – bringing cumulative investment to almost $20 million.
In 2008 ExxonMobil continued support for the Centre for Development and Population Activities’ Global Women in Management Program. Two hundred women from 35 countries have now been trained. This Program helps strengthen financial management skills of women managers working in community organizations in developing countries.
Reflecting our commitment to diversity, ExxonMobil supports networks for female, African-American, and Hispanic employees that provide mentoring, coaching, and strategies to enhance personal and professional development.
ExxonMobil is a member of the Women’s Leadership Board at Harvard University and committed $1.5 million in 2008 to Harvard’s “Closing the Gender Gap” research program, in addition to supporting research at the International Center for Research on Women. ExxonMobil also launched, in 2008, a mentoring program to link successful women leaders at Fortune 500 companies with high potential female students at local universities.
ExxonMobil continues to be the largest contributor to the Society of Women Engineers for outreach programs to young women, having provided $2.2 million in the past 10 years. In addition ExxonMobil provided a $1 million, five-year grant to Spelman College and Georgia Tech in 2006 to develop African-American women engineers through the Women in Science and Engineering (WISE) Program.
ITEM 10 – AMENDMENT OF EEO POLICY
This proposal was submitted by the New York City Employees’ Retirement System, 1 Centre Street, New York, NY 10007, as lead proponent of a filing group.
“Whereas:Exxon Mobil Corporation does not explicitly prohibit discrimination based on sexual orientation and gender identity in its written employment policy;
Over 88% of the Fortune 500 companies have adopted written nondiscrimination policies prohibiting harassment and discrimination on the basis of sexual orientation, as have more than 98% of Fortune 100 companies, according to the Human Rights Campaign; over 30% now prohibit discrimination based on gender identity;
We believe that corporations that prohibit discrimination on the basis of sexual orientation and gender identity have a competitive advantage in recruiting and retaining employees from the widest talent pool;
According to a June, 2008 survey by Harris Interactive and Witeck-Combs, 65% of gay and lesbian workers in the United States reported facing some form of job discrimination related to sexual orientation; an earlier survey found that almost one out of every 10 gay or lesbian adults also reported that they had been fired or dismissed unfairly from a previous job, or pressured to quit a job because of their sexual orientation;
Twenty states, the District of Columbia and more than 160 cities and counties, have laws prohibiting employment discrimination based on sexual orientation; 12 states and the District of Columbia have laws prohibiting employment discrimination based on sexual orientation and gender identity;
Minneapolis, San Francisco, Seattle and Los Angeles have adopted legislation restricting business with companies that do not guarantee equal treatment for gay and lesbian employees;
Our company has operations in, and makes sales to institutions in states and cities that prohibit discrimination on the basis of sexual orientation;
National public opinion polls consistently find more than three quarters of the American people support equal rights in the workplace for gay men, lesbians and bisexuals; for example, in a Gallup poll conducted in May, 2007, 89% of respondents favored equal opportunity in employment for gays and lesbians;
Resolved: The Shareholders request that Exxon Mobil Corporation amend its written equal employment opportunity policy to explicitly prohibit discrimination based on sexual orientation and gender identity and to substantially implement the policy.
Supporting Statement: Employment discrimination on the basis of sexual orientation and gender identity diminishes employee morale and productivity. Because state and local laws are inconsistent with respect to employment discrimination, our company would benefit from a consistent, corporate wide policy to enhance efforts to prevent discrimination, resolve complaints internally, and ensure a respectful and supportive atmosphere for all employees. Exxon Mobil Corporation will enhance its competitive edge by joining the growing ranks of companies guaranteeing equal opportunity for all employees.”
The Board recommends you vote AGAINST this proposal for the following reasons:
ExxonMobil is committed to having a workplace that facilitates the maximum contribution from all of our employees. While there are many factors that are important to creating this type of environment, one of the most significant is having a workplace that is free from any form of harassment or discrimination.
The Board has reviewed in detail ExxonMobil’s existing global policies that prohibit all forms of discrimination, including those based on sexual orientation and gender identity, in any Company
workplace, anywhere in the world. In fact ExxonMobil’s policies go beyond the law and prohibit any form of discrimination. Based on these existing all-inclusive, zero-tolerance policies, the Board believes the proposal is unnecessary.
The Corporation’s Equal Employment Opportunity (EEO) and Harassment in the Workplace policies, which are included in theStandards of Business Conduct (Standards), constitute the foundational documents of our employment nondiscrimination policy. The EEO communication initiatives, training programs, and investigating and stewardship processes explicitly state that any form of discrimination or harassment in the workplace based on sexual orientation will not be tolerated, and more broadly, that no form of discrimination or harassment in the workplace will be tolerated. It is these elements, as a totality, that constitute ExxonMobil’s policies.
As stated in the EEO portion of theStandards,the Corporation administers its personnel policies, programs, and practices in a nondiscriminatory manner in all aspects of the employment relationship, including recruitment, hiring, work assignment, promotion, transfer, termination, wage and salary administration, and selection for training. ExxonMobil is a meritocracy, with programs and policies designed to employ the best people, recognize and reward superior job performance, and to create an environment in which employees can maximize their contributions and reach their full potential. A discrimination-free environment is essential to meet these objectives.
Where we operate in countries in which the national laws require specific language regarding nondiscrimination based on sexual orientation or gender identity be included in policies, we have amended our policies as appropriate.
A written statement by our Chairman regarding ExxonMobil’s commitment to nondiscrimination, including that based on sexual orientation, is widely accessible to all employees on the Company intranet, and we provide training programs for new employees and refresher courses for existing employees. The harassment training material included in ourWorking Together booklet includes an example specifically based on sexual orientation. As a part of our ongoing policy compliance stewardship, ExxonMobil also has annual reporting and compliance procedures, which include a letter to all senior managers emphasizing their responsibilities regarding maintaining work environments free from harassment and discrimination.
ITEM 11 – GREENHOUSE GAS EMISSIONS GOALS
This proposal was submitted by the Sisters of St. Dominic of Caldwell New Jersey, 40 South Fullerton Avenue, Montclair, NJ 07042, as lead proponent of a filing group.
“WHEREAS:
The International Energy Agency warned in its2008 World Energy Outlook: ‘For all the uncertainties highlighted in this report, we can be certain that the energy world will look a lot different in 2030 than it does today. The world energy system will be transformed …‘
Cambridge Energy Research Associates’ (CERA) Chairman Daniel Yergin notes that ‘climate change and putting a price on carbon will change the dynamics of the energy marketplace.’ CERA further reports that clean energy investment could surpass $7 trillion by 2030 and that ‘clean energy is not a bubble or passing phenomenon. Clean energy is now poised to cross the divide and move from the fringes of the energy sector to the mainstream.’
Shareholders’ repeated request for emission reduction goals reiterates ExxonMobil’s own Environmental Business Planning process, which is used ‘to identify key environmental drivers …, set targets in key focus areas, and identify projects and actions to achieve those targets.’ (Carbon Disclosure Project 6 [CDP6], 3(a) iii)
Proponents believe ExxonMobil’s board never has sufficiently responded to shareholders in their request for an action plan and articulated goals for reducing GHG emissions from the Company’s products and operations.
ExxonMobil has set an energy efficiency target for operations of 10% by 2012, a 5,000-Megawatt cogeneration goal by 2011, and announced investments of $4 billion to reduce flaring. And the Company finally reduced direct GHGs in 2007, after a multi-year struggle with rising GHG emissions. However admirable, this progress is inadequate because the IEA estimates that, on average, only 10% of petroleum-related emissions are from industry operations.
ExxonMobil has recently announced $300 million for lithium ion battery technologies, and $100 million for carbon capture research. Yet, we believe ExxonMobil has done a poor job of articulating a cohesive business plan for dealing with climate risk and opportunity – especially regarding its products – or offered robust responses to the financial, regulatory, and technology impacts of the climate crisis.
BP, Royal Dutch Shell, ConocoPhillips, and Chevron have made newsworthy investments in renewables and low-carbon technologies to reduce emissions, and/or have begun integrating the cost of carbon into planning and investments. ConocoPhillips, BP America, and Shell have further endorsed calls for the U.S. to reduce carbon emissions by 60-80% by 2050.
We believe that ExxonMobil has not adequately assessed or disclosed the financial effects of climate regulation or industry-changing technologies. ‘We do not assess current and/or future financial effects because . . . In ExxonMobil’s view, it is impossible today to assess potential implications for shareholder value from regulatory approaches to address rising greenhouse gas concentrations.’(CDP6)
THEREFORE, BE IT RESOLVED: shareholders request that the Board of Directors adopt quantitative goals, based on current technologies, for reducing total greenhouse gas emissions from the Company’s products and operations; and that the Company report to shareholders by September 30, 2009, on its plans to achieve these goals. Such a report will omit proprietary information and be prepared at reasonable cost.”
The Board recommends you vote AGAINST this proposal for the following reasons:
In a world where ExxonMobil’s technical and management capabilities will be essential to meet growing global demand for energy and to address greenhouse gas emissions, the Board does not believe that setting absolute goals to reduce emissions from operations and product use is the most effective way to manage climate risks.
The fundamental challenge of meeting growing global demand in a responsible manner requires ongoing effort to improve efficiency and reduce emissions in the near term as production grows, and to invest in research and development to create effective, affordable, game-changing technologies that can be deployed on a large scale in the future. In the recent reportThe Outlook for Energy: A View to 2030 (available on our Web site), ExxonMobil provides a comprehensive discussion of the Company’s views and actions to manage its business, including steps to reduce emissions and improve product use, in the face of ongoing commercial, technological, political and regulatory risks. These risks include those from greenhouse gas emissions. ExxonMobil’s performance on these issues is also described in theCorporate Citizenship Report.
The Company’s primary opportunities to reduce greenhouse gas emissions from operations are in improving energy efficiency and reducing flaring. In both areas, the Company has established improvement objectives and planned improvement steps. For example, since 2004 ExxonMobil has invested more than $1.5 billion in activities that improve energy efficiency with a companion reduction in greenhouse gas emissions, and we will spend about one-half billion dollars over the next few years to continue this initiative. As part of the American Petroleum Institute’sVoluntary Climate Challenge Program, ExxonMobil committed to improve energy efficiency by 10 percent between 2002 and 2012 across U.S. refining operations. The Company is on pace to exceed that commitment, not only in the United States, but globally as well.
Emissions from ExxonMobil’s customers’ use of our products are determined both by their need for energy services and by the efficiency with which it is used. For years the Company has maintained
research to identify and develop technologies that improve the efficient use of its products. For example, over the past two years, ExxonMobil announced the development of a new technology for on-board hydrogen reforming to power fuel cell vehicles, deployment of new battery separator films for use in lithium-ion batteries in hybrid and electric vehicles, and a major pilot project to demonstrate a more efficient means to capture carbon dioxide from produced gas.
As described by ExxonMobil, the International Energy Agency, and others, even with the introduction of significant future improvements in energy efficiency, absolute greenhouse gas emissions will continue to increase in coming years to meet growing global energy demand.
As ExxonMobil seeks to increase production of oil and gas to meet growing global energy demand and to maintain leadership in return to shareholders, the Company will continue to take steps to improve efficiency, reduce emissions, and contribute to effective long-term solutions to manage climate risks.
ITEM 12 – CLIMATE CHANGE AND TECHNOLOGY REPORT
This proposal was submitted by Ms. Neva Rockefeller Goodwin, 30 Rockefeller Plaza, Room 5600, New York, NY 10112, as lead proponent of a filing group.
“Resolved:Shareholders ask Exxon Mobil Corporation’s (‘ExxonMobil’s’) Board of Directors to establish a task force, which should include both (a) two or more independent directors and (b) relevant company staff, to investigate and report to shareholders on the likely consequences of global climate change between now and 2030, for emerging countries, and poor communities in these countries and developed countries, and to compare these outcomes with scenarios in which ExxonMobil takes leadership in developing sustainable energy technologies that can be used by and for the benefit of those most threatened by climate change. The report should be prepared at reasonable expense, omitting proprietary information, and should be made available to shareholders by March 31, 2010.
SUPPORTING STATEMENT
The April 2007 Fourth Assessment from the United Nation’s Intergovernmental Panel on Climate Change (Working Group II) details the potential climate-change-related devastation that regions like Africa and Asia will suffer. IPCC Chairman Rajendra Pachauri noted that ‘It’s the poorest of the poor in the world, and this includes poor people even in prosperous societies, who are going to be the worst hit.’
This view is widely shared. As stated by The Prince Of Wales Corporate Leaders Group on Climate Change, an organization that includes AIG, Dupont, GE and GE,Sun Microsystems, in a November 30th,30th, 2007 Communique: ‘The economic and geopolitical costs of unabated climate change could be very severe and globally disruptive. All countries and economies will be affected, but it will be the poorest countries that will suffer earliest and the most’. As witnessed by the destructiondevastation brought on by hurricane Katrina, extreme climate events can devastate poor communities even in the United States.
ExxonMobil often argues that cheap and abundant energy is crucial for the economic advancement of poor economies. These countries are forecast, by ExxonMobil and others, to contribute the largest increase in energy use. However, if, as predicted by ExxonMobil, this energy use is based on continued reliance on hydrocarbons, we will see an unrelenting increase in global CO2CO2 emissions with devastating consequences especially for those who are poor in resources and influence, whether they live in the rich or the poor countries. To the extent that ExxonMobil’s growth continues to rely on the sale of hydrocarbon energy to emerging markets, it faces a painful paradox in the future, and distances itself from its true legacy. Part of John D. Rockefeller’s genius was in recognizing early on the need and opportunity of a transition to a better and cheaper fuel.
While investment in renewable energy sources and ‘clean’ technologies has recently accelerated, driven by players as diverse as venture capitalists, chemical companies, internet companies and old fashioned utilities, we believe our company is now lagging in creating solutions for the looming climate and energy crisis. We are concerned that ExxonMobil’s current slow course in exploring and promoting low carbon or carbon-free energy technologies will exacerbate the crisis rather than make ExxonMobil part of the solution.
We urge shareholders to vote for this proposal.”
The Board recommends you vote AGAINST this proposal for the following reasons:
The information requested in this proposal on possible climate impacts and on ExxonMobil’s views and actions on global climate change are alreadyis widely available in existing publications, including authoritative third-party assessments, that have been widely disseminated and provided to the proponent. In addition,view of the proponent and colleagues have extensively corresponded with directors and management representatives and personally have met with members of senior
management several times in recent years to review the Company’s climate change views and actions, and renewable energy technologies. Therefore,extensive, up-to-date information readily available, the Board does not believe an additional report is warranted.
A number of third-partyAuthoritative assessments of the impacts of climate change are publicly available, most notably in the recently publishedFourth Assessment Report of the Intergovernmental Panel on Climate Change
(IPCC, (IPCC, 2007), an effort in which ExxonMobil scientists directly participate.participated. The IPCC Report includes an entire, book-lengtha 900-page volume onImpacts and Adaptation that discusses impacts and vulnerability of society and ecosystems to future climate change. In view of the comprehensive material available, there is no need for an independent ExxonMobil report on climate impacts.
ExxonMobil’sExxonMobil continues to share our views on society’s requirements for future energy, demand, greenhouse gas emissions,the role of technology and policy options to limit growth ingreenhouse gas emissions, and ExxonMobil’s actions to address climate risks – most recently inThe Outlook for Energy: A View to 2030 (available on our Web site). Additional perspectives are available in several publications including:ExxonMobil’sTomorrow’s Energy, Corporate Citizenship Reportand our report to theCarbon Disclosure Project. These reports discuss anticipated future trends and the potential for various policies and technologies to limit future emissions.
The cited publicationsMeeting growing energy demand will require navigating a host of risks – commercial, technological, political, and executive speeches published on the ExxonMobil Web site also discussregulatory – as well as those associated with increased greenhouse gas emissions. TheOutlook provides a comprehensive discussion of ExxonMobil’s actions to reduce greenhouse gas emissions in its own operations and the steps we are taking to promote efficiency in the use of our products by customers. These actions include both research and development to create viable options to address climate risks,innovative technologies and steps to commercialize advanced technologies that will reduce future emissions.them.
ITEM 18 – ENERGY TECHNOLOGY REPORT
This proposal was submitted by the Province of St. Joseph of the Capuchin Order, 1015 North Ninth Street, Milwaukee, WI 53233.
“WHEREAS,ExxonMobil’s (XOM) energy supply faces increasing complexities and difficulties. This sourcing problem arises from various factors: a leveling of our oil supply in Non-OPEC nations, increasing volatility in OPEC nations, unilateral actions in countries like Venezuela who demand contract revisions, a lack of new refineries and old refineries that must be shut down for repairs.
Given such problems, many call for ‘U.S. energy independence.’ In interviews and debates among Republican Presidential candidates in 2007, John McCain envisioned the nation becoming ‘energy independent in five years.’ He called for a ‘Marshall Plan’ in this direction (12.12.07). He also noted a key obstacle toward this realization has been ‘special interests,’ including ‘petroleum companies’ (12.11.07). Another Republican candidate, Mike Huckabee, promised that, if elected, he would move the nation to become ‘oil free’ in our energy consumption in ten years (12.11.07).
This resolution’s proponents believe that, ideally, in an interconnected and interdependent world, every nation should have sufficient food and fuel to meet its basic needs, realized in ways that ensure sustainable development.
Among various options being considered that might move the U.S. toward energy independence and sustainability sooner rather than later is engineered geothermal development. This has been suggested by the Massachusetts Institute of Technology, a major recipient of XOM monies, in its effort to address the issue of greenhouse gas reduction and the promotion of alternative energy sources.
‘A comprehensive new MIT-led study of the potential for geothermal energy within the United States has found that mining the huge amounts of heat that reside as stored thermal energy in the Earth’s hard rock crust could supply a substantial portion of the electricity the United States will need in the future, probably at competitive prices and with minimal environmental impact… Just 2 percent of the U.S. geothermal resource base could yield nearly 2,000 times the power that the nation now consumes each year.’http://web.mit.edu/newsoffice/2007/geothermal.html
Commenting on this dramatic development,U.S. News and World Reportadded that, since geothermal energy, unlike solar or wind, is constant, MIT said it could provide 10% of U.S. base-load energy needs
[by 2050] if the nation would spend $1 billion on [jump-starting] its development over the next 15 years – less than the cost of one coal plant.http://www.usnews.com/articles/business/economy/2007/10/26/power-revolution.htm?PageNr=3
Sherri K. Stuewer, XOM’s Vice President, Safety, Health and Environment, stated 06.01.07: ‘We continue to look for opportunities where our expertise could help make a new energy technology viable on a large scale.’
To ensure any ‘new energy technology’ by ExxonMobil also helps move the U.S. toward energy independence in an environmentally sustainable way...
RESOLVED: shareholders request ExxonMobil’s Board of Directors to establish a Committee to study steps and report to shareholders, barring competitive information and disseminated at a reasonable expense, on how ExxonMobil can become the industry leader within a reasonable period in developing and making available the technology needed (such as sequestration and engineered geothermal) to enable the U.S.A. to become energy independent in an environmentally sustainable way.”
The Board recommends you vote AGAINST this proposal for the following reasons:
ExxonMobil is an industry leader in technology. To identify and develop energy options and improve efficiency, ExxonMobil maintains industry-leading capabilities in research and development spanning many energy options. Our efforts include proprietary research as well as support for and collaboration with leading academic and government laboratories.
As part of its base business strategy, ExxonMobil actively pursues research and commercial activities that contribute to energy security throughout the world by broadening the portfolio of commercially viable energy resources and by extending the life of identified resources through improvements in efficiency of energy supply and use. However, in opinion editorials and executive speeches, ExxonMobil strongly argues that the best way for the U.S., or any country, to successfully manage its energy needs is through interdependence, not energy independence, because, as we have stated before, energy independence is not a realistic possibility.
Because these research and commercialization activities are part of normal, ongoing business operations, the Board sees no need to publish a separate report aimed narrowly at the role of selected technologies in promoting energy independence for the U.S.
Current research activities include consideration of geothermal and other renewable energy sources, as well as efforts to use fossil fuels more efficiently and to reduce emissions, for example, through carbon capture and storage.
Whether or not to commercialize such options is a business decision, based on ExxonMobil’s capabilities, market analyses, and anticipated returns to shareholders. In the past year, ExxonMobil has announced the development of a new technology for on-board hydrogen reforming to power fuel cell vehicles and the deployment of new battery separator films for use in lithium-ion batteries in hybrid and electric vehicles.
ITEM 1913 – RENEWABLE ENERGY POLICY
This proposal was submitted by Mr. Stephen Viederman, 135 East 83rd Street, 15A, New York, NY 10028, as lead proponent of a filing group.
“ThereResolved: That ExxonMobil’s Board adopt a policy for renewable energy research, development and sourcing, reporting on its progress to investors in 2010.
In May 2008 the Board recommended voting against this resolution: ‘The Corporation is remarkable, near universal consensus among scientists regarding the need for aggressive actioninvesting at record levels in its traditional oil and gas development projects and is actively involved in research on climate change, supported by an overwhelming non-partisan cross section of 84 percent of Americans (Opinion Research Corporation, 11/07)alternative energy technologies’, as well as a fast growing number of corporations in all sectors of the global economy.
We share the view of the World Energy Council and the International Energy Agency that carbon-based energy sources must be significantly reduced, while undertaking a new focus on aggressively expanding renewable sources.
ExxonMobil ChairXOM Chair/CEO, Rex Tillerson acknowledges ‘it is increasingly clear that climate change poses risks to society and ecosystems that are serious enough towarrant action— action – by individuals, by businesses, and by governments.’
Energy efficiency and the advance of current proven emission-reducing technologies are necessary Warranted for some but not, sufficientapparently, others.
The activities noted inTomorrow’s Energy (which EXXON cited in January in its unsuccessful attempt to significantly reduce climate impacts.
ExxonMobil ‘believes technology is an essential component of any long-term plan to address climate change risks,’ but has done little with regard to renewable technologies. This contrasts withconvince the activities of ExxonMobil’s competitors: BP, Royal Dutch Shell,SEC that it had already implemented the resolution) are individual researchprojects onalternative energy rather thanrenewable energy technologies, and Chevron.certainly do not constitute apolicy as requested.
ExxonMobil’s 2007OutlookNopolicy statement on renewable energy research, renewable energy development, or renewable energy sourcing, can be found on XOM’s website.
XOM projects there will be growing demand for Energy: A View to 2030 projects renewables growing at 9 percent annually, oil and gas remaining indispensableuntil 2030.
The International Energy Agency (World Energy Outlook 2008) reflects ‘We can be certain that the energy world will look a lot different in 2030 than it does today,’ citing political and regulatory changes, projected higher prices for oil and gas, and the emergence of low-carbon energy technologies.
They observe, ‘It is within the power of all governments, … acting alone or together, to meetsteer the world towards cleaner, cleverer and more competitive energy demand,system.Time is running out and energy-related CO2 emissions increasingthe time to an annual levelact is now.’
And certainly there will be game-changing shifts on energy policy in the U.S. and the world.
Our company is spending $100 million on advertising to soften its image on these issues.
The $10 millionper year that XOM grants to Stanford for long-term research, only a small portion of 37 billion tonswhich deals with renewables, pales in comparison to this advertising budget, and is a rounding error compared to 27 billion tonsXOM’s total R&D budget.
Our company has the research and development capacity to create ‘game-changing renewable energy technologies’ (Tillerson) for the long-term.
What it lacks is the will, we believe.
Caught in 2005.
Mr. Tillerson recognizes ‘The energy challenges faced by the world are undeniable.’ ExxonMobil describes itself as ‘Takingnarrow mindset and culture of an oil and gas company, XOM is not prepared to make the transition from ‘taking on the world’s toughest energy challenges.’ However, ExxonMobil’s failing to enunciate a renewables’ policy reflects the thinking of a traditional[read oil and gas company, not a farseeinggas] challenges’ to ‘taking on the world’s toughest sustainable energy company.
The urgency reflected in Mr. Tillerson’s statements is not reflected in ExxonMobil’s policies and actions regarding renewables.system challenges.’
The World Energy Council makes clear ‘it is a myth that the task of meeting the world’s energy needs while addressing climate change is simply too expensive and too daunting.’
Breakthroughs in renewables will be made in the years ahead by companies in the forefront of renewables researchShell, BP, Chevron and development. Responding to increasing demand throughout the world—China has targeted 20% of its energy to come from renewables by 2020—will give corporate leaders a competitive advantage. While renewables now occupy a small market share, the availability of new and better renewable technologies will not only fill the growing demand, but also create new demand.
ExxonMobil’s research and development capabilities are uniquely positioned to meet theothers have decided that clean, renewable energy challenge and bring ithas a role to scale creating competitive advantage for our company.play in a different energy future.
Significant research and development on ‘game-changing technologies for the long-term’ (Tillerson, 11/12/07) is needed now that will meet both energy demand, and social and environmental goals, criteria proposed by the World Energy Council.
AsWe, as long-term investors, looking to and beyond 2030, ExxonMobil’sEnergy Outlook’s timeframe, we believerequest a farseeing renewable energy policy will create advantage forto guide our company.company in the decades ahead.
We, therefore, ask your support for this resolution:
RESOLVED: That ExxonMobil’s Board adoptThis resolution, presented at XOM’s 2008 AGM, received a policy for renewable energy research, development and sourcing, reporting on its progress to investors27.5% vote in 2009.favor.”
The Board recommends you vote AGAINST this proposal for the following reasons:
The Corporation’s annualOutlook for Energy –Energy: A View to 2030 highlights a substantial increase, released by ExxonMobil in energy demand in supportDecember 2008 and available on our Web site atexxonmobil.com/energyoutlook, outlines the magnitude of continued economic progress for the world’s growing population (available atexxonmobil.com/energyoutlook). To help meet this need,energy challenges. Growing populations and expanding economies are expected to increase global energy needs by 35 percent between 2005 and 2030, even with significant energy-efficiency gains. While all viable sources of energy should be pursued, the Corporation is investing at record levels in its traditional oilscale and gas development projects and is actively involved in research on alternativenature of the global energy technologies. Therefore, the Board believes this proposal is unwarranted.
Experts agreeoutlook mean that oil and gas, the Corporation’s primarytraditional business focus areas will remain indispensable for decades. Therefore the Board does not support this proposal.
As theOutlook indicates, reliable and affordable energy is critical to meetingeconomic progress and social welfare. While wind, solar, and biofuel energies will grow rapidly, they will likely reach just 2 percent of global energy supplies by 2030 and remain highly dependent on subsidies and mandates. At the same time, oil and natural gas demand for decades. In fact, consistent withis expected to grow much more in absolute terms, and remain close to 60 percent of global energy supplies. This reflects their abundance, availability, and affordability to meet consumer needs, as well as environmental advantages versus coal, theOutlook for Energy, the reference most carbon-intensive energy source.
case from theThe International Energy Agency (IEA) estimates that globalalso recognizes the world’s growing needs for oil and natural gas, demand growth through 2030 will be closeand increased its estimate of required investments to 10 times the combined amountan average of growth in biofuels, wind, solar, and geothermal. To meet oil and gas demand, the IEA projects the industry will need to invest, on average, approximately $380nearly $500 billion a year throughover 2007 to 2030. This signals a significant and growing call on the scale and capabilities of the Corporation and with that, the opportunity to provide tremendous value.
At the same time, ourMeeting growing energy demand and managing greenhouse gas emissions require an integrated set of solutions. The Corporation is committed to providing practical, broad-based solutions to help meet these challenges, consistent with long-term fundamentals and ExxonMobil’s proven approach to improve shareholder value. The Corporation’s active involvement in research on renewable and alternative energy technologies enables the Corporationit to readily assess new developments for possible commercialization and
investment as appropriate, to improve shareholder value. In addition to its own significant research, ExxonMobil is working with other institutions, including Stanford University’sGlobal Climate and Energy Project, the U.S. Department of Energy, and the European Commission to support breakthrough research to help meet energy and environmental challenges.
Finally, the Corporation’s views on long-term future energy and environmental challenges – including potential development of game-changing technologies –Additional perspectives are already reported to the public through its annualOutlook for Energy, Energy Trends reports (2004 and 2006), and other communications including the annualavailable in ExxonMobil’sCorporate Citizenship Report. A policy focus directed specifically at renewable energy forms would be too narrow and would not necessarily optimize the Company’s strategic strengths.
Other Business
We are not currently aware of any other business to be acted on at the meeting. Under the laws of New Jersey, where ExxonMobil is incorporated, no business other than procedural matters may be raised at the meeting unless proper notice has been given to the shareholders. If other business is properly raised, your proxies have authority to vote as they think best, including to adjourn the meeting.
People with Disabilities
We can provide reasonable assistance to help you participate in the meeting if you tell us about your disability and your plans to attend. Please call or write the Secretary at least two weeks before the meeting at the telephone number, address, or fax number listed under “Contact Information” on page 3.
Outstanding Shares
On February 29, 2008,28, 2009, there were 5,331,546,8104,922,925,742 shares of common stock outstanding. Each common share has one vote.
How We Solicit Proxies
In addition to this mailing, ExxonMobil officers and employees may solicit proxies personally, electronically, by telephone, or with additional mailings. ExxonMobil pays the costs of soliciting this proxy. We are paying D.F. King & Co. a fee of $30,000 plus expenses to help with the solicitation. We also reimburse brokers and other nominees for their expenses in sending these materials to you and getting your voting instructions.
Shareholder Proposals for Next Year
Any shareholder proposal for the annual meeting in 20092010 must be sent to the Secretary at the address or fax number of ExxonMobil’s principal executive office listed under “Contact Information” on page 3. The deadline for receipt of a proposal to be considered for inclusion in the proxy statement is 5:00 p.m., Central Time, on December 11, 2008.14, 2009. The deadline for notice of a proposal for which a shareholder will conduct his or her own solicitation is February 24, 2009.26, 2010. On request the Secretary will provide instructions for submitting proposals.
Duplicate Annual Reports
Registered shareholders with multiple accounts may authorize ExxonMobil to discontinue mailing extra annual reports by marking the “discontinue annual report mailing for this account” box on the proxy
card. If you vote via the Internet or by telephone, you will also have the opportunity to indicate that you wish to discontinue receiving extra annual reports. At least one account must continue to receive an annual report. Eliminating these duplicate mailings will not affect receipt of future proxy statements and proxy cards.
Also, youYou may discontinue duplicate mailings by calling ExxonMobil Shareholder Services at the toll-free telephone number listed under “Contact Information” on page 4 at any time during the year. Beneficial holders can contact their banks, brokers, or other holders of record to discontinue duplicate mailings.
Shareholders with the Same Address
If you share an address with one or more ExxonMobil shareholders, you may elect to “household” your proxy mailing. This means you will receive only one annual report and proxy statement at that address unless one or more shareholders at that address specifically elect to receive separate mailings. Shareholders who participate in householding will continue to receive separate proxy cards. Also, householdingHouseholding will not affect dividend check mailings. We will promptly send a separate annual report and proxy statement to a shareholder at a shared address on request. Shareholders with a shared address may also request us to send separate annual reports and proxy statements in the future, or to send a single copy in the future, if we are currently sending multiple copies to the same address.
Requests related to householding should be made by calling ExxonMobil Shareholder Services at the telephone number listed under “Contact Information” on page 4. Beneficial shareholders can request information about householding from their banks, brokers, or other holders of record.
Financial Statements
The year 20072008 consolidated financial statements and auditor’sauditors’ report, management’s discussion and analysis of financial condition and results of operations, information concerning the quarterly financial data for the past two fiscal years, and other information, including stock performance graphs, are provided in Appendix A.
SEC Form 10-K
Shareholders may obtain a copy of the Corporation’sAnnual Report on Form 10-K to the Securities and Exchange Commission without charge by writing to the Secretary at the address listed under “Contact Information” on page 3, or by visiting ExxonMobil’s Web site atexxonmobil.com/financialpublications.
TABLE OF CONTENTS
| A2 | ||
| A3 | ||
| A4 | ||
| A6 | ||
Management’s Discussion and Analysis of Financial Condition and Results of Operations | ||
| A7 | ||
| A8 | ||
| A8 | ||
| A8 | ||
| A15 | ||
| A16 | ||
| A16 | ||
Recently Issued Statements of Financial Accounting Standards | ||
| A18 | ||
Management’s Report on Internal Control Over Financial Reporting | A22 | |
| A22 | ||
| A24 | ||
| A25 | ||
| A26 | ||
| A27 | ||
| A28 | ||
2. Accounting Change for | A30 | |
| A30 | ||
8. Property, Plant and Equipment and Asset Retirement Obligations | ||
Supplemental Information on Oil and Gas Exploration and Production Activities | ||
A1
| Earnings After Income Taxes | Average Capital Employed | Return on Average Capital Employed | Capital and Exploration Expenditures | ||||||||||||||||||||||||||||||||||||||||||||
Financial | Earnings After Income Taxes | Average Capital Employed | Return on Average Capital Employed | Capital and Exploration Expenditures | |||||||||||||||||||||||||||||||||||||||||||
| 2007 | 2006 | 2007 | 2006 | 2007 | 2006 | 2007 | 2006 | 2008 | 2007 | 2008 | 2007 | 2008 | 2007 | 2008 | 2007 | ||||||||||||||||||||||||||||||||
| (millions of dollars) | (percent) | (millions of dollars) | (millions of dollars) | (percent) | (millions of dollars) | ||||||||||||||||||||||||||||||||||||||||||
Upstream | |||||||||||||||||||||||||||||||||||||||||||||||
United States | $ | 4,870 | $ | 5,168 | $ | 14,026 | $ | 13,940 | 34.7 | 37.1 | $ | 2,212 | $ | 2,486 | $ | 6,243 | $ | 4,870 | $ | 14,651 | $ | 14,026 | 42.6 | 34.7 | $ | 3,334 | $ | 2,212 | |||||||||||||||||||
Non-U.S. | 21,627 | 21,062 | 49,539 | 43,931 | 43.7 | 47.9 | 13,512 | 13,745 | 29,159 | 21,627 | 51,413 | 49,539 | 56.7 | 43.7 | 16,400 | 13,512 | |||||||||||||||||||||||||||||||
Total | $ | 26,497 | $ | 26,230 | $ | 63,565 | $ | 57,871 | 41.7 | 45.3 | $ | 15,724 | $ | 16,231 | $ | 35,402 | $ | 26,497 | $ | 66,064 | $ | 63,565 | 53.6 | 41.7 | $ | 19,734 | $ | 15,724 | |||||||||||||||||||
Downstream | |||||||||||||||||||||||||||||||||||||||||||||||
United States | $ | 4,120 | $ | 4,250 | $ | 6,331 | $ | 6,456 | 65.1 | 65.8 | $ | 1,128 | $ | 824 | $ | 1,649 | $ | 4,120 | $ | 6,963 | $ | 6,331 | 23.7 | 65.1 | $ | 1,636 | $ | 1,128 | |||||||||||||||||||
Non-U.S. | 5,453 | 4,204 | 18,983 | 17,172 | 28.7 | 24.5 | 2,175 | 1,905 | 6,502 | 5,453 | 18,664 | 18,983 | 34.8 | 28.7 | 1,893 | 2,175 | |||||||||||||||||||||||||||||||
Total | $ | 9,573 | $ | 8,454 | $ | 25,314 | $ | 23,628 | 37.8 | 35.8 | $ | 3,303 | $ | 2,729 | $ | 8,151 | $ | 9,573 | $ | 25,627 | $ | 25,314 | 31.8 | 37.8 | $ | 3,529 | $ | 3,303 | |||||||||||||||||||
Chemical | |||||||||||||||||||||||||||||||||||||||||||||||
United States | $ | 1,181 | $ | 1,360 | $ | 4,748 | $ | 4,911 | 24.9 | 27.7 | $ | 360 | $ | 280 | $ | 724 | $ | 1,181 | $ | 4,535 | $ | 4,748 | 16.0 | 24.9 | $ | 441 | $ | 360 | |||||||||||||||||||
Non-U.S. | 3,382 | 3,022 | 8,682 | 8,272 | 39.0 | 36.5 | 1,422 | 476 | 2,233 | 3,382 | 9,990 | 8,682 | 22.4 | 39.0 | 2,378 | 1,422 | |||||||||||||||||||||||||||||||
Total | $ | 4,563 | $ | 4,382 | $ | 13,430 | $ | 13,183 | 34.0 | 33.2 | $ | 1,782 | $ | 756 | $ | 2,957 | $ | 4,563 | $ | 14,525 | $ | 13,430 | 20.4 | 34.0 | $ | 2,819 | $ | 1,782 | |||||||||||||||||||
Corporate and financing | (23 | ) | 434 | 26,451 | 27,891 | — | — | 44 | 139 | (1,290 | ) | (23 | ) | 23,467 | 26,451 | — | — | 61 | 44 | ||||||||||||||||||||||||||||
Total | $ | 40,610 | $ | 39,500 | $ | 128,760 | $ | 122,573 | 31.8 | 32.2 | $ | 20,853 | $ | 19,855 | $ | 45,220 | $ | 40,610 | $ | 129,683 | $ | 128,760 | 34.2 | 31.8 | $ | 26,143 | $ | 20,853 | |||||||||||||||||||
See Frequently Used Terms for a definition and calculation of capital employed and return on average capital employed.
Operating | 2007 | 2006 | ||
| (thousands of barrels daily) | ||||
Net liquids production | ||||
United States | 392 | 414 | ||
Non-U.S. | 2,224 | 2,267 | ||
Total | 2,616 | 2,681 | ||
| (millions of cubic feet daily) | ||||
Natural gas production available for sale | ||||
United States | 1,468 | 1,625 | ||
Non-U.S. | 7,916 | 7,709 | ||
Total | 9,384 | 9,334 | ||
| (thousands of oil-equivalent barrels daily) | ||||
Oil-equivalent production(1) | 4,180 | 4,237 | ||
| (thousands of barrels daily) | ||||
Refinery throughput | ||||
United States | 1,746 | 1,760 | ||
Non-U.S. | 3,825 | 3,843 | ||
Total | 5,571 | 5,603 | ||
| (thousands of barrels daily) | ||||
Petroleum product sales | ||||
United States | 2,717 | 2,729 | ||
Non-U.S. | 4,382 | 4,518 | ||
Total | 7,099 | 7,247 | ||
| (thousands of metric tons) | ||||
Chemical prime product sales | ||||
United States | 10,855 | 10,703 | ||
Non-U.S. | 16,625 | 16,647 | ||
Total | 27,480 | 27,350 | ||
Operating | 2008 | 2007 | ||
| (thousands of barrels daily) | ||||
Net liquids production | ||||
United States | 367 | 392 | ||
Non-U.S. | 2,038 | 2,224 | ||
Total | 2,405 | 2,616 | ||
| (millions of cubic feet daily) | ||||
Natural gas production available for sale | ||||
United States | 1,246 | 1,468 | ||
Non-U.S. | 7,849 | 7,916 | ||
Total | 9,095 | 9,384 | ||
| (thousands of oil-equivalent barrels daily) | ||||
Oil-equivalent production(1) | 3,921 | 4,180 | ||
| (thousands of barrels daily) | ||||
Refinery throughput | ||||
United States | 1,702 | 1,746 | ||
Non-U.S. | 3,714 | 3,825 | ||
Total | 5,416 | 5,571 | ||
| (thousands of barrels daily) | ||||
Petroleum product sales | ||||
United States | 2,540 | 2,717 | ||
Non-U.S. | 4,221 | 4,382 | ||
Total | 6,761 | 7,099 | ||
| (thousands of metric tons) | ||||
Chemical prime product sales | ||||
United States | 9,526 | 10,855 | ||
Non-U.S. | 15,456 | 16,625 | ||
Total | 24,982 | 27,480 | ||
| (1) | Gas converted to oil-equivalent at 6 million cubic feet = 1 thousand barrels. |
A2
| 2007 | 2006 | 2005 | 2004 | 2003 | ||||||||||||||||
| (millions of dollars, except per share amounts) | ||||||||||||||||||||
Sales and other operating revenue(1) (2) | $ | 390,328 | $ | 365,467 | $ | 358,955 | $ | 291,252 | $ | 237,054 | ||||||||||
Earnings | ||||||||||||||||||||
Upstream | $ | 26,497 | $ | 26,230 | $ | 24,349 | $ | 16,675 | $ | 14,502 | ||||||||||
Downstream | 9,573 | 8,454 | 7,992 | 5,706 | 3,516 | |||||||||||||||
Chemical | 4,563 | 4,382 | 3,943 | 3,428 | 1,432 | |||||||||||||||
Corporate and financing | (23 | ) | 434 | (154 | ) | (479 | ) | 1,510 | ||||||||||||
Income from continuing operations | $ | 40,610 | $ | 39,500 | $ | 36,130 | $ | 25,330 | $ | 20,960 | ||||||||||
Cumulative effect of accounting change, net of income tax | — | — | — | — | 550 | |||||||||||||||
Net income | $ | 40,610 | $ | 39,500 | $ | 36,130 | $ | 25,330 | $ | 21,510 | ||||||||||
Net income per common share | ||||||||||||||||||||
Income from continuing operations | $ | 7.36 | $ | 6.68 | $ | 5.76 | $ | 3.91 | $ | 3.16 | ||||||||||
Net income per common share – assuming dilution | ||||||||||||||||||||
Income from continuing operations | $ | 7.28 | $ | 6.62 | $ | 5.71 | $ | 3.89 | $ | 3.15 | ||||||||||
Cumulative effect of accounting change, net of income tax | — | — | — | — | 0.08 | |||||||||||||||
Net income | $ | 7.28 | $ | 6.62 | $ | 5.71 | $ | 3.89 | $ | 3.23 | ||||||||||
Cash dividends per common share | $ | 1.37 | $ | 1.28 | $ | 1.14 | $ | 1.06 | $ | 0.98 | ||||||||||
Net income to average shareholders’ equity (percent) | 34.5 | 35.1 | 33.9 | 26.4 | 26.2 | |||||||||||||||
Working capital | $ | 27,651 | $ | 26,960 | $ | 27,035 | $ | 17,396 | $ | 7,574 | ||||||||||
Ratio of current assets to current liabilities | 1.47 | 1.55 | 1.58 | 1.40 | 1.20 | |||||||||||||||
Additions to property, plant and equipment | $ | 15,387 | $ | 15,462 | $ | 13,839 | $ | 11,986 | $ | 12,859 | ||||||||||
Property, plant and equipment, less allowances | $ | 120,869 | $ | 113,687 | $ | 107,010 | $ | 108,639 | $ | 104,965 | ||||||||||
Total assets | $ | 242,082 | $ | 219,015 | $ | 208,335 | $ | 195,256 | $ | 174,278 | ||||||||||
Exploration expenses, including dry holes | $ | 1,469 | $ | 1,181 | $ | 964 | $ | 1,098 | $ | 1,010 | ||||||||||
Research and development costs | $ | 814 | $ | 733 | $ | 712 | $ | 649 | $ | 618 | ||||||||||
Long-term debt | $ | 7,183 | $ | 6,645 | $ | 6,220 | $ | 5,013 | $ | 4,756 | ||||||||||
Total debt | $ | 9,566 | $ | 8,347 | $ | 7,991 | $ | 8,293 | $ | 9,545 | ||||||||||
Fixed-charge coverage ratio (times) | 49.9 | 46.3 | 50.2 | 36.1 | 30.8 | |||||||||||||||
Debt to capital (percent) | 7.1 | 6.6 | 6.5 | 7.3 | 9.3 | |||||||||||||||
Net debt to capital (percent)(3) | (24.0 | ) | (20.4 | ) | (22.0 | ) | (10.7 | ) | (1.2 | ) | ||||||||||
Shareholders’ equity at year end | $ | 121,762 | $ | 113,844 | $ | 111,186 | $ | 101,756 | $ | 89,915 | ||||||||||
Shareholders’ equity per common share | $ | 22.62 | $ | 19.87 | $ | 18.13 | $ | 15.90 | $ | 13.69 | ||||||||||
Weighted average number of common shares outstanding (millions) | 5,517 | 5,913 | 6,266 | 6,482 | 6,634 | |||||||||||||||
Number of regular employees at year end (thousands)(4) | 80.8 | 82.1 | 83.7 | 85.9 | 88.3 | |||||||||||||||
CORS employees not included above (thousands)(5) | 26.3 | 24.3 | 22.4 | 19.3 | 17.4 | |||||||||||||||
| 2008 | 2007 | 2006 | 2005 | 2004 | ||||||||||||||||
| (millions of dollars, except per share amounts) | ||||||||||||||||||||
Sales and other operating revenue(1) (2) | $ | 459,579 | $ | 390,328 | $ | 365,467 | $ | 358,955 | $ | 291,252 | ||||||||||
Earnings | ||||||||||||||||||||
Upstream | $ | 35,402 | $ | 26,497 | $ | 26,230 | $ | 24,349 | $ | 16,675 | ||||||||||
Downstream | 8,151 | 9,573 | 8,454 | 7,992 | 5,706 | |||||||||||||||
Chemical | 2,957 | 4,563 | 4,382 | 3,943 | 3,428 | |||||||||||||||
Corporate and financing | (1,290 | ) | (23 | ) | 434 | (154 | ) | (479 | ) | |||||||||||
Net income | $ | 45,220 | $ | 40,610 | $ | 39,500 | $ | 36,130 | $ | 25,330 | ||||||||||
Net income per common share | $ | 8.78 | $ | 7.36 | $ | 6.68 | $ | 5.76 | $ | 3.91 | ||||||||||
Net income per common share – assuming dilution | $ | 8.69 | $ | 7.28 | $ | 6.62 | $ | 5.71 | $ | 3.89 | ||||||||||
Cash dividends per common share | $ | 1.55 | $ | 1.37 | $ | 1.28 | $ | 1.14 | $ | 1.06 | ||||||||||
Net income to average shareholders’ equity (percent) | 38.5 | 34.5 | 35.1 | 33.9 | 26.4 | |||||||||||||||
Working capital | $ | 23,166 | $ | 27,651 | $ | 26,960 | $ | 27,035 | $ | 17,396 | ||||||||||
Ratio of current assets to current liabilities (times) | 1.47 | 1.47 | 1.55 | 1.58 | 1.40 | |||||||||||||||
Additions to property, plant and equipment | $ | 19,318 | $ | 15,387 | $ | 15,462 | $ | 13,839 | $ | 11,986 | ||||||||||
Property, plant and equipment, less allowances | $ | 121,346 | $ | 120,869 | $ | 113,687 | $ | 107,010 | $ | 108,639 | ||||||||||
Total assets | $ | 228,052 | $ | 242,082 | $ | 219,015 | $ | 208,335 | $ | 195,256 | ||||||||||
Exploration expenses, including dry holes | $ | 1,451 | $ | 1,469 | $ | 1,181 | $ | 964 | $ | 1,098 | ||||||||||
Research and development costs | $ | 847 | $ | 814 | $ | 733 | $ | 712 | $ | 649 | ||||||||||
Long-term debt | $ | 7,025 | $ | 7,183 | $ | 6,645 | $ | 6,220 | $ | 5,013 | ||||||||||
Total debt | $ | 9,425 | $ | 9,566 | $ | 8,347 | $ | 7,991 | $ | 8,293 | ||||||||||
Fixed-charge coverage ratio (times) | 52.2 | 49. 9 | 46.3 | 50.2 | 36.1 | |||||||||||||||
Debt to capital (percent) | 7.4 | 7.1 | 6.6 | 6.5 | 7.3 | |||||||||||||||
Net debt to capital (percent)(3) | (23.0 | ) | (24.0 | ) | (20.4 | ) | (22.0 | ) | (10.7 | ) | ||||||||||
Shareholders’ equity at year end | $ | 112,965 | $ | 121,762 | $ | 113,844 | $ | 111,186 | $ | 101,756 | ||||||||||
Shareholders’ equity per common share | $ | 22.70 | $ | 22.62 | $ | 19.87 | $ | 18.13 | $ | 15.90 | ||||||||||
Weighted average number of common shares outstanding (millions) | 5,149 | 5,517 | 5,913 | 6,266 | 6,482 | |||||||||||||||
Number of regular employees at year end (thousands)(4) | 79.9 | 80.8 | 82.1 | 83.7 | 85.9 | |||||||||||||||
CORS employees not included above (thousands)(5) | 24.8 | 26.3 | 24.3 | 22.4 | 19.3 | |||||||||||||||
| (1) | Sales and other operating revenue includes sales-based taxes of $34,508 million for 2008, $31,728 million for 2007, $30,381 million for 2006, $30,742 million for 2005 and $27,263 million for |
| (2) | Sales and other operating revenue includes $30,810 million for 2005 and $25,289 million for 2004 |
| (3) | Debt net of cash, excluding restricted cash. |
| (4) | Regular employees are defined as active executive, management, professional, technical and wage employees who work full time or part time for the Corporation and are covered by the Corporation’s benefit plans and programs. |
| (5) | CORS employees are employees of company-operated retail sites. |
A3
Listed below are definitions of several of ExxonMobil’s key business and financial performance measures. These definitions are provided to facilitate understanding of the terms and their calculation.
CASH FLOW FROM OPERATIONS AND ASSET SALES
Cash flow from operations and asset sales is the sum of the net cash provided by operating activities and proceeds from sales of subsidiaries, investments and property, plant and equipment from the Consolidated Statement of Cash Flows. This cash flow reflects the total sources of cash from both operating the Corporation’s assets and from the divesting of assets. The Corporation employs a long-standing and regular disciplined review process to ensure that all assets are contributing to the Corporation’s strategic and financial objectives. Assets are divested when they are no longer meeting these objectives or are worth considerably more to others. Because of the regular nature of this activity, we believe it is useful for investors to consider sales proceeds together with cash provided by operating activities when evaluating cash available for investment in the business and financing activities, including shareholder distributions.
Cash flow from operations and asset sales | 2007 | 2006 | 2005 | 2008 | 2007 | 2006 | ||||||||||||
| (millions of dollars) | (millions of dollars) | |||||||||||||||||
Net cash provided by operating activities | $ | 52,002 | $ | 49,286 | $ | 48,138 | $ | 59,725 | $ | 52,002 | $ | 49,286 | ||||||
Sales of subsidiaries, investments and property, plant and equipment | 4,204 | 3,080 | 6,036 | 5,985 | 4,204 | 3,080 | ||||||||||||
Cash flow from operations and asset sales | $ | 56,206 | $ | 52,366 | $ | 54,174 | $ | 65,710 | $ | 56,206 | $ | 52,366 | ||||||
CAPITAL EMPLOYED
Capital employed is a measure of net investment. When viewed from the perspective of how the capital is used by the businesses, it includes ExxonMobil’s net share of property, plant and equipment and other assets less liabilities, excluding both short-term and long-term debt. When viewed from the perspective of the sources of capital employed in total for the Corporation, it includes ExxonMobil’s share of total debt and shareholders’ equity. Both of these views include ExxonMobil’s share of amounts applicable to equity companies, which the Corporation believes should be included to provide a more comprehensive measure of capital employed.
Capital employed | 2007 | 2006 | 2005 | 2008 | 2007 | 2006 | ||||||||||||||||||
| (millions of dollars) | (millions of dollars) | |||||||||||||||||||||||
Business uses: asset and liability perspective | ||||||||||||||||||||||||
Total assets | $ | 242,082 | $ | 219,015 | $ | 208,335 | $ | 228,052 | $ | 242,082 | $ | 219,015 | ||||||||||||
Less liabilities and minority share of assets and liabilities | ||||||||||||||||||||||||
Total current liabilities excluding notes and loans payable | (55,929 | ) | (47,115 | ) | (44,536 | ) | (46,700 | ) | (55,929 | ) | (47,115 | ) | ||||||||||||
Total long-term liabilities excluding long-term debt and equity of minority and preferred shareholders in affiliated companies | (50,543 | ) | (45,905 | ) | (41,095 | ) | ||||||||||||||||||
Total long-term liabilities excluding long-term debt and equity of minority interests | (54,404 | ) | (50,543 | ) | (45,905 | ) | ||||||||||||||||||
Minority share of assets and liabilities | (5,332 | ) | (4,948 | ) | (4,863 | ) | (6,044 | ) | (5,332 | ) | (4,948 | ) | ||||||||||||
Add ExxonMobil share of debt-financed equity company net assets | 3,386 | 2,808 | 3,450 | 4,798 | 3,386 | 2,808 | ||||||||||||||||||
Total capital employed | $ | 133,664 | $ | 123,855 | $ | 121,291 | $ | 125,702 | $ | 133,664 | $ | 123,855 | ||||||||||||
Total corporate sources: debt and equity perspective | ||||||||||||||||||||||||
Notes and loans payable | $ | 2,383 | $ | 1,702 | $ | 1,771 | $ | 2,400 | $ | 2,383 | $ | 1,702 | ||||||||||||
Long-term debt | 7,183 | 6,645 | 6,220 | 7,025 | 7,183 | 6,645 | ||||||||||||||||||
Shareholders’ equity | 121,762 | 113,844 | 111,186 | 112,965 | 121,762 | 113,844 | ||||||||||||||||||
Less minority share of total debt | (1,050 | ) | (1,144 | ) | (1,336 | ) | (1,486 | ) | (1,050 | ) | (1,144 | ) | ||||||||||||
Add ExxonMobil share of equity company debt | 3,386 | 2,808 | 3,450 | 4,798 | 3,386 | 2,808 | ||||||||||||||||||
Total capital employed | $ | 133,664 | $ | 123,855 | $ | 121,291 | $ | 125,702 | $ | 133,664 | $ | 123,855 | ||||||||||||
A4
RETURN ON AVERAGE CAPITAL EMPLOYED
Return on average capital employed (ROCE) is a performance measure ratio. From the perspective of the business segments, ROCE is annual business segment earnings divided by average business segment capital employed (average of beginning and end-of-year amounts). These segment earnings include ExxonMobil’s share of segment earnings of equity companies, consistent with our capital employed definition, and exclude the cost of financing. The Corporation’s total ROCE is net income excluding the after-tax cost of financing, divided by total corporate average capital employed. The Corporation has consistently applied its ROCE definition for many years and views it as the best measure of historical capital productivity in our capital-intensive, long-term industry, both to evaluate management’s performance and to demonstrate to shareholders that capital has been used wisely over the long term. Additional measures, which are more cash flow-based, are used to make investment decisions.
Return on average capital employed | 2007 | 2006 | 2005 | 2008 | 2007 | 2006 | ||||||||||||||||||
| (millions of dollars) | (millions of dollars) | |||||||||||||||||||||||
Net income | $ | 40,610 | $ | 39,500 | $ | 36,130 | $ | 45,220 | $ | 40,610 | $ | 39,500 | ||||||||||||
Financing costs (after tax) | ||||||||||||||||||||||||
Gross third-party debt | (339 | ) | (264 | ) | (261 | ) | (343 | ) | (339 | ) | (264 | ) | ||||||||||||
ExxonMobil share of equity companies | (204 | ) | (156 | ) | (144 | ) | (325 | ) | (204 | ) | (156 | ) | ||||||||||||
All other financing costs – net | 268 | 499 | (35 | ) | 1,485 | 268 | 499 | |||||||||||||||||
Total financing costs | (275 | ) | 79 | (440 | ) | 817 | (275 | ) | 79 | |||||||||||||||
Earnings excluding financing costs | $ | 40,885 | $ | 39,421 | $ | 36,570 | $ | 44,403 | $ | 40,885 | $ | 39,421 | ||||||||||||
Average capital employed | $ | 128,760 | $ | 122,573 | $ | 116,961 | $ | 129,683 | $ | 128,760 | $ | 122,573 | ||||||||||||
Return on average capital employed – corporate total | 31.8 | % | 32.2 | % | 31.3 | % | 34.2 | % | 31.8 | % | 32.2 | % | ||||||||||||
A5
| 2007 | 2006 | |||||||||||||||||||||
| First Quarter | Second Quarter | Third Quarter | Fourth Quarter | Year | First Quarter | Second Quarter | Third Quarter | Fourth Quarter | Year | |||||||||||||
Volumes | ||||||||||||||||||||||
| (thousands of barrels daily) | ||||||||||||||||||||||
Production of crude oil and natural gas liquids | 2,746 | 2,668 | 2,537 | 2,517 | 2,616 | 2,698 | 2,702 | 2,647 | 2,678 | 2,681 | ||||||||||||
Refinery throughput | 5,705 | 5,279 | 5,582 | 5,717 | 5,571 | 5,548 | 5,407 | 5,756 | 5,698 | 5,603 | ||||||||||||
Petroleum product sales | 7,198 | 6,973 | 7,100 | 7,125 | 7,099 | 7,177 | 7,060 | 7,302 | 7,447 | 7,247 | ||||||||||||
| (millions of cubic feet daily) | ||||||||||||||||||||||
Natural gas production available for sale | 10,114 | 8,733 | 8,283 | 10,414 | 9,384 | 11,175 | 8,754 | 8,139 | 9,301 | 9,334 | ||||||||||||
| (thousands of oil-equivalent barrels daily) | ||||||||||||||||||||||
Oil-equivalent production(1) | 4,432 | 4,123 | 3,918 | 4,253 | 4,180 | 4,560 | 4,161 | 4,004 | 4,228 | 4,237 | ||||||||||||
| (thousands of metric tons) | ||||||||||||||||||||||
Chemical prime product sales | 6,805 | 6,897 | 6,729 | 7,049 | 27,480 | 6,916 | 6,855 | 6,752 | 6,827 | 27,350 | ||||||||||||
Summarized financial data | ||||||||||||||||||||||
| (millions of dollars) | ||||||||||||||||||||||
Sales and other operating revenue (2) | $ | 84,174 | 95,059 | 99,130 | 111,965 | 390,328 | $ | 86,317 | 96,024 | 96,268 | 86,858 | 365,467 | ||||||||||
Gross profit (3) | $ | 33,907 | 36,760 | 36,114 | 39,914 | 146,695 | $ | 33,428 | 37,668 | 37,117 | 33,764 | 141,977 | ||||||||||
Net income | $ | 9,280 | 10,260 | 9,410 | 11,660 | 40,610 | $ | 8,400 | 10,360 | 10,490 | 10,250 | 39,500 | ||||||||||
Per share data | ||||||||||||||||||||||
| (dollars per share) | ||||||||||||||||||||||
Net income per common share | $ | 1.64 | 1.85 | 1.72 | 2.15 | 7.36 | $ | 1.38 | 1.74 | 1.79 | 1.77 | 6.68 | ||||||||||
Net income per common share – assuming dilution | $ | 1.62 | 1.83 | 1.70 | 2.13 | 7.28 | $ | 1.37 | 1.72 | 1.77 | 1.76 | �� | 6.62 | |||||||||
Dividends per common share | $ | 0.32 | 0.35 | 0.35 | 0.35 | 1.37 | $ | 0.32 | 0.32 | 0.32 | 0.32 | 1.28 | ||||||||||
Common stock prices | ||||||||||||||||||||||
High | $ | 76.35 | 86.58 | 93.66 | 95.27 | 95.27 | $ | 63.96 | 65.00 | 71.22 | 79.00 | 79.00 | ||||||||||
Low | $ | 69.02 | 75.28 | 78.76 | 83.37 | 69.02 | $ | 56.42 | 56.64 | 61.63 | 64.84 | 56.42 | ||||||||||
| 2008 | 2007 | |||||||||||||||||||||
| First Quarter | Second Quarter | Third Quarter | Fourth Quarter | Year | First Quarter | Second Quarter | Third Quarter | Fourth Quarter | Year | |||||||||||||
Volumes | ||||||||||||||||||||||
| (thousands of barrels daily) | ||||||||||||||||||||||
Production of crude oil and natural gas liquids | 2,468 | 2,391 | 2,290 | 2,472 | 2,405 | 2,746 | 2,668 | 2,537 | 2,517 | 2,616 | ||||||||||||
Refinery throughput | 5,526 | 5,472 | 5,354 | 5,313 | 5,416 | 5,705 | 5,279 | 5,582 | 5,717 | 5,571 | ||||||||||||
Petroleum product sales | 6,821 | 6,775 | 6,688 | 6,761 | 6,761 | 7,198 | 6,973 | 7,100 | 7,125 | 7,099 | ||||||||||||
| (millions of cubic feet daily) | ||||||||||||||||||||||
Natural gas production available for sale | 10,229 | 8,489 | 7,820 | 9,849 | 9,095 | 10,114 | 8,733 | 8,283 | 10,414 | 9,384 | ||||||||||||
| (thousands of oil-equivalent barrels daily) | ||||||||||||||||||||||
Oil-equivalent production (1) | 4,173 | 3,806 | 3,593 | 4,113 | 3,921 | 4,432 | 4,123 | 3,918 | 4,253 | 4,180 | ||||||||||||
| (thousands of metric tons) | ||||||||||||||||||||||
Chemical prime product sales | 6,578 | 6,718 | 6,060 | 5,626 | 24,982 | 6,805 | 6,897 | 6,729 | 7,049 | 27,480 | ||||||||||||
Summarized financial data | ||||||||||||||||||||||
| (millions of dollars) | ||||||||||||||||||||||
Sales and other operating revenue(2) | $ | 113,223 | 133,776 | 132,085 | 80,495 | 459,579 | $ | 84,174 | 95,059 | 99,130 | 111,965 | 390,328 | ||||||||||
Gross profit(3) | $ | 40,255 | 43,925 | 45,901 | 29,760 | 159,841 | $ | 33,907 | 36,760 | 36,114 | 39,914 | 146,695 | ||||||||||
Net income | $ | 10,890 | 11,680 | 14,830 | 7,820 | 45,220 | $ | 9,280 | 10,260 | 9,410 | 11,660 | 40,610 | ||||||||||
Per share data | ||||||||||||||||||||||
| (dollars per share) | ||||||||||||||||||||||
Net income per common share (4) | $ | 2.05 | 2.25 | 2.89 | 1.57 | 8.78 | $ | 1.64 | 1.85 | 1.72 | 2.15 | 7.36 | ||||||||||
Net income per common share – assuming dilution(4) | $ | 2.03 | 2.22 | 2.86 | 1.55 | 8.69 | $ | 1.62 | 1.83 | 1.70 | 2.13 | 7.28 | ||||||||||
Dividends per common share | $ | 0.35 | 0.40 | 0.40 | 0.40 | 1.55 | $ | 0.32 | 0.35 | 0.35 | 0.35 | 1.37 | ||||||||||
Common stock prices | ||||||||||||||||||||||
High | $ | 94.74 | 96.12 | 89.63 | 83.64 | 96.12 | $ | 76.35 | 86.58 | 93.66 | 95.27 | 95.27 | ||||||||||
Low | $ | 77.55 | 84.26 | 71.51 | 56.51 | 56.51 | $ | 69.02 | 75.28 | 78.76 | 83.37 | 69.02 | ||||||||||
| (1) | Gas converted to oil-equivalent at 6 million cubic feet = 1 thousand barrels. |
| (2) | Includes amounts for sales-based taxes. |
| (3) | Gross profit equals sales and other operating revenue less estimated costs associated with products sold. |
| (4) | Computed using the average number of shares outstanding during each period. The sum of the four quarters may not add to the full year. |
The price range of ExxonMobil common stock is as reported on the composite tape of the several U.S. exchanges where ExxonMobil common stock is traded. The principal market where ExxonMobil common stock (XOM) is traded is the New York Stock Exchange, although the stock is traded on other exchanges in and outside the United States.
There were 566,565546,588 registered shareholders of ExxonMobil common stock at December 31, 2007.2008. At January 31, 2008,2009, the registered shareholders of ExxonMobil common stock numbered 561,103.540,892.
On January 30, 2008,28, 2009, the Corporation declared a $0.35$0.40 dividend per common share, payable March 10, 2008.2009.
A6
MANAGEMENT’S DISCUSSION AND ANALYSIS OF FINANCIAL CONDITION AND RESULTS OF OPERATIONS
| 2007 | 2006 | 2005 | 2008 | 2007 | 2006 | |||||||||||||||||
| (millions of dollars, except per share amounts) | (millions of dollars, except per share amounts) | |||||||||||||||||||||
Net income (U.S. GAAP) | ||||||||||||||||||||||
Upstream | ||||||||||||||||||||||
United States | $ | 4,870 | $ | 5,168 | $ | 6,200 | $ | 6,243 | $ | 4,870 | $ | 5,168 | ||||||||||
Non-U.S. | 21,627 | 21,062 | 18,149 | 29,159 | 21,627 | 21,062 | ||||||||||||||||
Downstream | ||||||||||||||||||||||
United States | 4,120 | 4,250 | 3,911 | 1,649 | 4,120 | 4,250 | ||||||||||||||||
Non-U.S. | 5,453 | 4,204 | 4,081 | 6,502 | 5,453 | 4,204 | ||||||||||||||||
Chemical | ||||||||||||||||||||||
United States | 1,181 | 1,360 | 1,186 | 724 | 1,181 | 1,360 | ||||||||||||||||
Non-U.S. | 3,382 | 3,022 | 2,757 | 2,233 | 3,382 | 3,022 | ||||||||||||||||
Corporate and financing | (23 | ) | 434 | (154 | ) | (1,290 | ) | (23 | ) | 434 | ||||||||||||
Net income | $ | 40,610 | $ | 39,500 | $ | 36,130 | $ | 45,220 | $ | 40,610 | $ | 39,500 | ||||||||||
Net income per common share | $ | 7.36 | $ | 6.68 | $ | 5.76 | $ | 8.78 | $ | 7.36 | $ | 6.68 | ||||||||||
Net income per common share – assuming dilution | $ | 7.28 | $ | 6.62 | $ | 5.71 | $ | 8.69 | $ | 7.28 | $ | 6.62 | ||||||||||
Special items included in net income | ||||||||||||||||||||||
Non-U.S. Upstream | ||||||||||||||||||||||
Gain on Dutch gas restructuring | $ | — | $ | — | $ | 1,620 | ||||||||||||||||
U.S. Downstream | ||||||||||||||||||||||
Allapattah lawsuit provision | $ | — | $ | — | $ | (200 | ) | |||||||||||||||
Non-U.S. Downstream | ||||||||||||||||||||||
Sale of Sinopec shares | $ | — | $ | — | $ | 310 | ||||||||||||||||
Non-U.S. Chemical | ||||||||||||||||||||||
Sale of Sinopec shares | $ | — | $ | — | $ | 150 | ||||||||||||||||
Joint venture litigation | $ | — | $ | — | $ | 390 | ||||||||||||||||
Gain on German natural gas transportation business sale | $ | 1,620 | $ | — | $ | — | ||||||||||||||||
Corporate and financing | ||||||||||||||||||||||
Tax-related benefit | $ | — | $ | 410 | $ | — | $ | — | $ | — | $ | 410 | ||||||||||
Valdez litigation | $ | (460 | ) | $ | — | $ | — | |||||||||||||||
A7
MANAGEMENT’S DISCUSSION AND ANALYSIS OF FINANCIAL CONDITION AND RESULTS OF OPERATIONS
Statements in this discussion regarding expectations, plans and future events or conditions are forward-looking statements. Actual future results, including demand growth and energy source mix; capacity increases; production growth and mix; financing sources; the resolution of contingencies;contingencies and uncertain tax positions; the effect of changes in prices; interest rates and other market conditions; and environmental and capital expenditures could differ materially depending on a number of factors, such as the outcome of commercial negotiations; changes in the supply of and demand for crude oil, natural gas, and petroleum and petrochemical products; political or regulatory events; and other factors discussed herein and in Item 1A of ExxonMobil’s 20072008 Form 10-K.
The following discussion and analysis of ExxonMobil’s financial results, as well as the accompanying financial statements and related notes to consolidated financial statements to which they refer, are the responsibility of the management of Exxon Mobil Corporation. The Corporation’s accounting and financial reporting fairly reflect its straightforward business model involving the extracting, manufacturing and marketing of hydrocarbons and hydrocarbon-based products. The Corporation’s business model involves the production (or purchase), manufacture and sale of physical products, and all commercial activities are directly in support of the underlying physical movement of goods. Our consistent, conservative approach to financing the capital-intensive needs of the Corporation has helped ExxonMobil to sustain the “triple-A” status of its long-term debt securities for 8990 years.
ExxonMobil, with its resource base, financial strength, disciplined investment approach and technology portfolio, is well-positioned to participate in substantial investments to develop new energy supplies. While commodity prices are volatile on a short-term basis and depend on supply and demand, ExxonMobil’s investment decisions are based on our long-term business outlook, using a disciplined approach in selecting and pursuing the most attractive investment opportunities. The corporate plan is a fundamental annual management process that is the basis for setting near-term operating and capital objectives in addition to providing the longer-term economic assumptions used for investment evaluation purposes. Volumes are based on individual field production profiles, which are also updated annually. Prices for crude oil, natural gas and refined products are based on corporate plan assumptions developed annually by major region and are utilized for investment evaluation purposes. Potential investment opportunities are tested over a wide range of economic scenarios to establish the resiliency of each opportunity. Once investments are made, a reappraisal process is completed to ensure relevant lessons are learned and improvements are incorporated into future projects.
BUSINESS ENVIRONMENT AND RISK ASSESSMENT
Long-Term Business Outlook
By 2030, the world’s population is projected to grow to approximately 8 billion people, or about 1.5 billion more than 20 percent higher than today’s level.in 2005. Coincident with this population increase, the Corporation expects worldwide economic growth to average close to 3 percent per year. This combination of population and economic growth is expected to lead to aan increase in primary energy demand increase of approximately 4035 percent by 2030 versus 2005.2005 even with substantial efficiency gains. The vast majority (~80(over 90 percent) of the demand increase is expected to occur in developing countries.
As economic progress drives demand rises, energy efficiencyhigher, the use of more energy-efficient technologies and practices will become increasingly important, with the rateleading to a significantly lower level of improvement projected to increase.energy consumption per unit of economic output by 2030. Efficiency gains will result from anticipated improvements in the transportation and power generation sectors, driven by the introduction of new technologies, as well as many other improvements that span the residential, commercial and industrial sectors. A
Energy for transportation – including cars, trucks, ships, trains and airplanes – is expected to increase by 40 percent from 2005 to 2030. The global growth in transportation demand will be met primarily by oil, which is expected to provide almost 95 percent of all transportation fuel by 2030, down from about 98 percent in 2005, as biofuels and natural gas gain market share.
Demand for electricity around the world will grow significantly through 2030. Consistent with this projection, power generation will remain the largest and fastest-growing segment of global energy demand. Meeting the expected growth in power demand will require a diverse set of energy sources. Coal will retain the largest share, however natural gas, nuclear and renewables are all expected to gain market share.
Liquid fuels provide the largest share of energy supply today due to their availability, affordability and ease of transport. By 2030, global demand for liquids is expected to grow to approximately 108 million barrels of oil-equivalent per day or close to 30 percent more than in 2005. Global demand for liquid fuels will be met by a wide variety of energysources. Conventional non-OPEC crude and condensate production is expected to remain relatively flat through 2030. However, growth is expected from a number of supply sources, will be requiredincluding biofuels, oil sands and natural gas liquids, as well as crude oil from OPEC countries. While the world’s resource base is sufficient to meet increasingprojected demand, access to resources and timely investments will remain critical to meeting global demand.needs.
A8
Increases in natural gas demand in North America, Europe and Asia Pacific will require new sources of supply, primarily from imports. The growing need for natural gas imports will have a dramatic impact on the worldwide liquefied natural gas (LNG) market, which is expected to more than triple in volume by 2030.
The world’s energy mix is highly diverse and will remain so through 2030. Oil gas and coal areis expected to remain the predominantlargest source of energy sources with approximately 80 percent sharesupply at close to 35 percent. Natural gas is expected to grow the fastest of total energy. Oilthe fossil fuels and gas areovertake coal as the second-largest energy source. Nuclear power is projected to maintain close to a 60 percent share. These well-establishedgrow significantly, surpassing coal in terms of absolute growth and becoming the fourth-largest fuel sources aresource. Hydro and geothermal will also grow, though remain limited by the only ones with the versatility and scale to meet the majorityavailability of the world’s growing energy needs over the outlook period. Nuclear power will likely be a growing option to meet electricity needs. Among renewable energy sources, wind,natural sites. Wind, solar and biofuels are anticipatedexpected to grow rapidly at about 9 percent per year reflecting government subsidieson average, the highest growth rate of all fuels, and mandates. These energy sources are projected to reach approximately 2 percent of world energy by 2030, up from 0.5 percent currently.
Demand for liquid fuels is expected to grow at 1.3 percent per year from 2005 to 2030, primarily due to increasing transportation requirements, especially related to light- and heavy-duty vehicles. The global fleet of light-duty vehicles will increase significantly, with related demand partly offset by improvements in fuel economy. Natural gas and coal are projected to grow at 1.7 and 0.9 percent per year, respectively, driven by rising needs for electric power generation. The Corporation expects the liquefied natural gas (LNG) market to increase over 250 percent by 2030, with LNG imports helping to meet growing demand in Europe, North America and Asia. With equity positions in many of the largest remote gas accumulations in the world, the Corporation is positioned to benefit from its technological advances in gas liquefaction, transportation and regasification that enable distant gas supplies to reach markets economically.2030.
The Corporation anticipates that the world’s available oil and gas resource base will grow not only from new discoveries, but also from reserve increases to known reserves.in previously discovered fields. Technology will underpin these increases. The cost to develop and supply these resources will be significant. According to the International Energy Agency, the investment required to meet total oil and gas energy needs worldwide through 2030 will be about $380close to $500 billion per year on average, or about $9.5$11.7 trillion (measured in 20062007 dollars) in total for 2006-2030.2007-2030.
Upstream
ExxonMobil continues to maintain a large portfolio of development and exploration opportunities, which enables the Corporation to be selective, optimizing total profitabilitymaximizing shareholder value and mitigating overall political and technical risks. ExxonMobil’s fundamental Upstream business strategies guide our global exploration, development, production, and gas and power marketing activities. These strategies include identifying and pursuing all attractive exploration opportunities, investing in projects that deliver superior returns, maximizing profitability of existing oil and gas production, and capitalizing on growing natural gas and power markets. These strategies are underpinned by a relentless focus on operational excellence, commitment to innovative technologies, development of our employees and investment in the communities in which we operate.
As future development projects bring new production online, the Corporation expects a shift in the geographic mix of its production volumes between now and 2012.2013. Oil and natural gas output from West Africa, the Caspian region, the Middle East and Russia is expected to increase over the next five years based on current capital project execution plans. Currently, these growth areas account for 3839 percent of the Corporation’s production. By 2012,2013, they are expected to generate about 50 percent of total volumes. The remainder of the Corporation’s production is expected to be sourced from established areas, including Europe, North America and Asia Pacific.
A8
In addition to a changing geographic mix, there will also be a change in the type of opportunities from which volumes are produced. Nonconventional production utilizing specialized technology such as arctic technology, deepwater drilling and production systems, heavy oil recovery processes, tight gas production and LNG is expected to grow from about 30 percent to over 40 percent of the Corporation’s output between now and 2012.2013. The Corporation’s overall volume capacity outlook, based on projects coming onstream as anticipated, is for production capacity to grow over the period 2008-2012.2009-2013. However, actual volumes will vary from year to year due to the timing of individual project start-ups, operational outages, reservoir performance, performance of enhanced oil recovery projects, regulatory changes, asset sales, weather events, price effects under production sharing contracts and other factors described in Item 1A of ExxonMobil’s 20072008 Form 10-K. Enhanced oil recovery projects extract hydrocarbons from reservoirs in excess of that which may be produced through primary recovery, i.e., through pressure depletion or natural aquifer support. They include the injection of water, gases or chemicals into a reservoir to produce hydrocarbons otherwise unobtainable.
Downstream
ExxonMobil’s Downstream is a large, diversified business with marketingrefining and refiningmarketing complexes around the world. The Corporation has a strong presence in mature markets in North America and Europe, as well as inthe growing areas, such as the Asia Pacific region. The objective of ExxonMobil’s fundamental Downstream business strategies is to position the Corporationcompany to be the industry leader underdeliver long-term growth in shareholder value that is superior to competition across a varietyrange of market conditions. These strategies include maintaining best-in-class operations in all aspects of the business, maximizing value from leading-edge technology,technologies, capitalizing on integration with other ExxonMobil businesses, selectively investing for resilient, advantaged returns, leading the industry in efficiency and effectiveness, and providing quality, valued products and services to customers.
ExxonMobil has an ownership interest in 37 refineries, located in 20 countries, with distillation capacity of 6.2 million barrels per day and lubricant basestock manufacturing capacity of about 140 thousand barrels per day. ExxonMobil’s fuels and lubes marketing business portfolios include operations around the Corporation’s customers.world, serving a globally diverse customer base.
The downstream industry environment remains very competitive. RefiningThe industry has experienced a period of robust refining margins, have been relatively strongwhich has encouraged the construction of additional industry capacity. However, over the past few years. However,prior 20-year period, inflation-adjusted refining margins over the prior 20 years have declined at aan average rate of about 1 percent per year. The intense competitionRefining margins are largely driven by differences in the retail fuels market has similarly driven down inflation-adjusted margins by about 3 percent per year. Refining marginscommodity prices and are a function of the difference between what a refinery pays for its raw materials (primarily crude oil) and the market prices for the range of products produced (primarily gasoline, heating oil, diesel oil, jet fuel and fuel oil). Crude oil and many products are widely traded with published prices, including those quoted on multiple exchanges around the world (e.g., New York Mercantile Exchange and IntercontinentalExchange)Intercontinental Exchange). Prices for these commodities (crude and various products) are determined by the global marketplace and are influenced by many factors, including global and regional supply/demand balances, inventory levels, refinery operations, import/export balances, seasonal demand, weather and political climate.
ExxonMobil has an ownership interest
A9
MANAGEMENT’S DISCUSSION AND ANALYSIS OF FINANCIAL CONDITION AND RESULTS OF OPERATIONS
ExxonMobil’s long-term outlook continues to be that refining margins will generally decline as refineries continue to improve efficiency and, in 38 refineries, locatedthe near term, new capacity additions outpace the growth in 21 countries, with distillation capacity of 6.3 million barrels per day and lubricant basestock manufacturing capacity of about 140 thousand barrels per day. ExxonMobil’sglobal demand.
In the retail fuels and lubes marketing business, portfolios include operations aroundongoing intense competition continues to drive down inflation-adjusted margins by about 3 percent per year. In 2008, ExxonMobil announced its intention to transition out of the world, servingdirect served (i.e., dealer, company-operated) retail business in U.S. markets and to convert a globally diverse customer base.majority of markets to a branded distributor model. This transition will be a multiyear process.
ExxonMobil’s Downstream capital expenditures areremain focused on selective and resilient investments. These investments capitalize on the Corporation’s world-class scale and integration, industry-leading efficiency, leading-edge technology and respected brands, enabling ExxonMobil to take advantage of attractive emerging-growth opportunities around the globe. For example, in mid-2007,2008, ExxonMobil alongannounced plans to invest over $1 billion in three refineries to increase the supply of cleaner burning diesel by about 140 thousand barrels per day. The company will construct new units and modify existing facilities at its Baton Rouge, La., Baytown, Texas, and Antwerp, Belgium, refineries. ExxonMobil is also participating in an integrated refining, petrochemicals and fuels marketing venture in Fujian, China, with our partners Saudi Aramco, Sinopec and Fujian Province. The manufacturing portion of the venture will expand an existing 80-thousand-barrel-per-day refinery in the Fujian Province formed the only fullyto a 240-thousand-barrel-per-day high-conversion facility. The project also includes a new world-scale integrated refining, petrochemicals andchemical plant. The project is expected to start up in 2009. The fuels marketing portion of the venture with foreign participation in China. In addition, ExxonMobil successfully started up several projects that produce lower-sulfur motor fuels, including gasoline projects in Japanincludes approximately 750 retail sites and diesel projects in North America and Europe, with additional start-ups planned for 2008.a network of distribution terminals.
Chemical
The strengthWorldwide petrochemical demand decreased in 2008, reflecting the global economic slowdown in the second half of the global economy supportedyear. Despite record high feedstock costs, chemical growth continued solid demand growth for petrochemicals in 2007. Strong economic and industrial production growththe first half of the year fueled by increased demand in Asia Pacific, particularly China. North AmericanAs a result, supply/demand balances supported higher product prices during this period. Demand dropped sharply in the second half of the year, reflecting slower economic growth and European growthbroad supply chain inventory de-stocking during rapid feedstock cost declines. With this demand decrease, margins weakened and industry operating rates were moderate, similar to that of GDP. Overall the global supply/demand balance remained tight, supporting continued strong margins despite higher feedstock costs.cut back.
ExxonMobil benefited from continued operational excellence as well asand a balanced portfolio of products that includes many of the largest-volume and highest-growth petrochemicals in the global economy.products. In addition to being a worldwide supplier of primary petrochemical products, ExxonMobil Chemical also has a diverse portfolionumber of less-cyclical business lines. Chemical’s competitive advantages are achieved through its business mix, broad geographic coverage, investment discipline, integration of chemical capacity with large refining complexesrefineries or Upstreamupstream gas processing facilities, advantaged feedstock capabilities, leading proprietary technology and product application expertise.
REVIEW OF 20072008 AND 20062007 RESULTS
| 2007 | 2006 | 2005 | |||||||
| (millions of dollars) | |||||||||
Net income (U.S. GAAP) | $ | 40,610 | $ | 39,500 | $ | 36,130 | |||
| 2008 | 2007 | 2006 | |||||||
| (millions of dollars) | |||||||||
Net income (U.S. GAAP) | $ | 45,220 | $ | 40,610 | $ | 39,500 | |||
2008
Net income in 2008 of $45,220 million was a record for the Corporation, up $4,610 million from 2007. Net income for 2008 included an after-tax gain of $1,620 million from the sale of a natural gas transportation business in Germany and after-tax special charges of $460 million related to the Valdez litigation.
2007
Net income in 2007 of $40,610 million was the highest ever for the Corporation, up $1,110 million from 2006. Net income for 2006 included a $410 million gain from the recognition of tax benefits related to historical investments in non-U.S. assets. Earnings in 2007 were also at record levels
Upstream
| 2008 | 2007 | 2006 | |||||||
| (millions of dollars) | |||||||||
Upstream | |||||||||
United States | $ | 6,243 | $ | 4,870 | $ | 5,168 | |||
Non-U.S. | 29,159 | 21,627 | 21,062 | ||||||
Total | $ | 35,402 | $ | 26,497 | $ | 26,230 | |||
2008
Upstream earnings for each business segment.
2006
Net income in 20062008 totaled $35,402 million, an increase of $39,500 million was up $3,370$8,905 million from 2005. Net income2007, including an after-tax gain of $1,620 million from the sale of a natural gas transportation business in Germany. Record high crude oil and natural gas realizations increased earnings approximately $11.8 billion. Lower sales volumes reduced earnings about $3.7 billion. Higher taxes and increased operating costs decreased earnings approximately $1.5 billion, partially offset by favorable foreign exchange. Oil-equivalent production decreased 6 percent versus 2007, including impacts from lower entitlement volumes, the expropriation of assets in Venezuela and divestments. Excluding these impacts, total oil-equivalent production decreased 3 percent. Liquids production of 2,405 kbd (thousands of barrels per day) decreased 211 kbd from 2007. Production increases from new projects in West Africa were more than offset by field decline, lower entitlement volumes, the expropriation of assets in Venezuela and divestments. Natural gas production of 9,095 mcfd (millions of cubic feet per day) decreased 289 mcfd from 2007. Higher volumes from North Sea, Malaysia and Qatar projects and higher European demand were more than offset by field decline. Earnings from U.S. Upstream operations for 2006 included2008 were $6,243 million, an increase of $1,373 million. Earnings outside the U.S. for 2008, including a $410$1,620 million gain from the recognition of tax benefits related to historical investmentsthe sale of the German natural gas transportation business, were $29,159 million, $7,532 million higher than in non-U.S. assets.2007.
A9A10
MANAGEMENT’S DISCUSSION AND ANALYSIS OF FINANCIAL CONDITION AND RESULTS OF OPERATIONS
Upstream
| 2007 | 2006 | 2005 | |||||||
| (millions of dollars) | |||||||||
Upstream | |||||||||
United States | $ | 4,870 | $ | 5,168 | $ | 6,200 | |||
Non-U.S. | 21,627 | 21,062 | 18,149 | ||||||
Total | $ | 26,497 | $ | 26,230 | $ | 24,349 | |||
2007
Upstream earnings for 2007 totaled $26,497 million, an increase of $267 million from 2006. Higher liquids realizations were mostly offset by higherincreased earnings approximately $3.1 billion, while lower natural gas realizations decreased earnings about $600 million. Higher operating expenses and net unfavorable tax effects.effects reduced earnings about $2.2 billion. Oil-equivalent production decreased 1 percent versus 2006, including the expropriation of assets in Venezuela, expropriation, divestments, OPEC quota effects, and price and spend impacts on volumes. Excluding these impacts, total oil-equivalent production increased by 1 percent. Liquids production of 2,616 kbd (thousands of barrels per day) decreased by 65 kbd from 2006. Production increases from new projects in West Africa and higher Russia volumes were offset by mature field decline and production sharing contract net interest reductions. Natural gas production of 9,384 mcfd (millions of cubic feet per day) increased 50 mcfd from 2006. Higher volumes from projects in Qatar and the North Sea were mostly offset by mature field decline. Earnings from U.S. Upstream operations for 2007 were $4,870 million, a decrease of $298 million. Earnings outside the U.S. for 2007 were $21,627 million, an increase of $565 million.
2006
Upstream earnings for 2006 totaled $26,230 million, an increase of $1,881 million from 2005, including a $1,620 million gain related to the Dutch gas restructuring in 2005. Higher liquids and natural gas realizations were partly offset by higher operating expenses. Oil-equivalent production increased 4 percent versus 2005. Liquids production of 2,681 kbd increased by 158 kbd from 2005. Production increases from new projects in West Africa and increased Abu Dhabi volumes were partly offset by mature field decline, entitlement effects and divestment impacts. Natural gas production of 9,334 mcfd increased 83 mcfd from 2005. Higher volumes from projects in Qatar were partly offset by mature field decline. Earnings from U.S. Upstream operations for 2006 were $5,168 million, a decrease of $1,032 million. Earnings outside the U.S. for 2006 were $21,062 million, an increase of $2,913 million, including a $1,620 million gain related to the Dutch gas restructuring in 2005.
Downstream
| 2007 | 2006 | 2005 | 2008 | 2007 | 2006 | |||||||||||||
| (millions of dollars) | (millions of dollars) | |||||||||||||||||
Downstream | ||||||||||||||||||
United States | $ | 4,120 | $ | 4,250 | $ | 3,911 | $ | 1,649 | $ | 4,120 | $ | 4,250 | ||||||
Non-U.S. | 5,453 | 4,204 | 4,081 | 6,502 | 5,453 | 4,204 | ||||||||||||
Total | $ | 9,573 | $ | 8,454 | $ | 7,992 | $ | 8,151 | $ | 9,573 | $ | 8,454 | ||||||
2008
Downstream earnings of $8,151 million were $1,422 million lower than in 2007. Lower margins reduced earnings approximately $900 million, as weaker refining margins more than offset stronger marketing margins. Higher operating costs, mainly associated with planned work activity, reduced earnings about $700 million, while unfavorable foreign exchange effects decreased earnings approximately $600 million. Improved refinery operations provided a partial offset, increasing earnings about $800 million. Petroleum product sales of 6,761 kbd decreased from 7,099 kbd in 2007, primarily reflecting asset sales and lower demand. Refinery throughput was 5,416 kbd compared with 5,571 kbd in 2007. U.S. Downstream earnings were $1,649 million, down $2,471 million from 2007. Non-U.S. Downstream earnings of $6,502 million were $1,049 million higher than in 2007.
2007
Downstream earnings totaled $9,573 million, an increase of $1,119 million from 2006. Improved worldwide refining operations andincreased earnings approximately $800 million, while higher gains on asset sales primarily outside the U.S., were partly offset by lowerimproved earnings about $900 million. Lower refining margins.margins decreased earnings approximately $600 million. Petroleum product sales of 7,099 kbd decreased from 7,247 kbd in 2006, primarily due to divestment impacts. Refinery throughput was 5,571 kbd compared with 5,603 kbd in 2006, with the decrease again due to divestments.2006. U.S. Downstream earnings of $4,120 million decreased by $130 million. Non-U.S. Downstream earnings of $5,453 million were $1,249 million higher than 2006.
2006
Downstream earnings totaled $8,454 million, an increase of $462 million from 2005, including a $310 million gain for the 2005 Sinopec share sale and a special charge of $200 million related to the 2005 Allapattah lawsuit provision. Stronger worldwide refining and marketing margins were partly offset by lower refining throughput. Petroleum product sales of 7,247 kbd decreased from 7,519 kbd in 2005, primarily due to lower refining throughput and divestment impacts. Refinery throughput was 5,603 kbd compared with 5,723 kbd in 2005. U.S. Downstream earnings of $4,250 million increased by $339 million, including a 2005 special charge related to the Allapattah lawsuit provision. Non-U.S. Downstream earnings of $4,204 million were $123 million higher than 2005 earnings, which included a gain for the Sinopec share sale.2006.
Chemical
| 2007 | 2006 | 2005 | 2008 | 2007 | 2006 | |||||||||||||
| (millions of dollars) | (millions of dollars) | |||||||||||||||||
Chemical | ||||||||||||||||||
United States | $ | 1,181 | $ | 1,360 | $ | 1,186 | $ | 724 | $ | 1,181 | $ | 1,360 | ||||||
Non-U.S. | 3,382 | 3,022 | 2,757 | 2,233 | 3,382 | 3,022 | ||||||||||||
Total | $ | 4,563 | $ | 4,382 | $ | 3,943 | $ | 2,957 | $ | 4,563 | $ | 4,382 | ||||||
20072008
Chemical earnings totaled $4,563$2,957 million, an increasea decrease of $181$1,606 million from 2006. Increased 20072007. Lower margins reduced earnings were driven by higher salesapproximately $1.2 billion, while lower volumes and favorable foreign exchange effects partly offset by lower margins.decreased earnings about $500 million. Prime product sales were 27,48024,982 kt (thousands of metric tons), an increasea decrease of 130 kt.2,498 kt from last year. Prime product sales are total chemical product sales, including ExxonMobil’s share of equity-company volumes and finished-product transfers to the Downstream business. Carbon black oil and sulfur volumes are excluded. U.S. Chemical earnings of $724 million decreased $457 million. Non-U.S. Chemical earnings of $2,233 million were $1,149 million lower than in 2007.
2007
Chemical earnings totaled $4,563 million, an increase of $181 million from 2006. Higher sales volumes and favorable foreign exchange effects increased earnings approximately $450 million, while lower margins reduced earnings about $325 million. Prime product sales were 27,480 kt, an increase of 130 kt. U.S. Chemical earnings of $1,181 million decreased by $179 million. Non-U.S. Chemical earnings of $3,382 million were $360 million higher than in 2006.
A10A11
2006MANAGEMENT’S DISCUSSION AND ANALYSIS OF FINANCIAL CONDITION AND RESULTS OF OPERATIONS
Chemical earnings totaled $4,382 million, an increase of $439 million from 2005, including a $390 million gain from the favorable resolution of joint venture litigation in 2005 and a $150 million gain for the 2005 Sinopec share sale. Increased 2006 earnings were driven by higher margins and increased sales volumes. Prime product sales were 27,350 kt, an increase of 573 kt. U.S. Chemical earnings of $1,360 million increased by $174 million. Non-U.S. Chemical earnings of $3,022 million were $265 million higher than 2005 earnings, which included gains from the favorable resolution of joint venture litigation and the Sinopec share sale.
Corporate and Financing
| 2007 | 2006 | 2005 | |||||||||
| (millions of dollars) | |||||||||||
Corporate and financing | $ | (23 | ) | $ | 434 | $ | (154 | ) | |||
| 2008 | 2007 | 2006 | |||||||||
| (millions of dollars) | |||||||||||
Corporate and financing | $ | (1,290 | ) | $ | (23 | ) | $ | 434 | |||
2008
Corporate and financing expenses of $1,290 million in 2008 increased $1,267 million from 2007, mainly due to charges of $460 million related to the Valdez litigation, net higher taxes and lower interest income.
2007
Corporate and financing expenses were $23 million in 2007, compared to an earnings contribution of $434 million in 2006, which included a $410 million gain from tax benefits related to historical investments in non-U.S. assets.
2006
The corporate and financing segment contributed $434 million to earnings in 2006, up $588 million from 2005, primarily due to a $410 million gain from tax benefits related to historical investments in non-U.S. assets and higher interest income.
LIQUIDITY AND CAPITAL RESOURCES
Sources and Uses of Cash
| 2007 | 2006 | 2008 | 2007 | 2006 | ||||||||||||||||
| (millions of dollars) | (millions of dollars) | |||||||||||||||||||
Net cash provided by/(used in) | ||||||||||||||||||||
Operating activities | $ | 52,002 | $ | 49,286 | $ | 59,725 | $ | 52,002 | $ | 49,286 | ||||||||||
Investing activities | (9,728 | ) | (14,230 | ) | (15,499 | ) | (9,728 | ) | (14,230 | ) | ||||||||||
Financing activities | (38,345 | ) | (36,210 | ) | (44,027 | ) | (38,345 | ) | (36,210 | ) | ||||||||||
Effect of exchange rate changes | 1,808 | 727 | (2,743 | ) | 1,808 | 727 | ||||||||||||||
Increase/(decrease) in cash and cash equivalents | $ | 5,737 | $ | (427 | ) | $ | (2,544 | ) | $ | 5,737 | $ | (427 | ) | |||||||
| (Dec. 31) | (Dec. 31) | |||||||||||||||||||
Cash and cash equivalents | $ | 33,981 | $ | 28,244 | $ | 31,437 | $ | 33,981 | $ | 28,244 | ||||||||||
Cash and cash equivalents – restricted | — | 4,604 | — | — | 4,604 | |||||||||||||||
Total cash and cash equivalents | $ | 33,981 | $ | 32,848 | $ | 31,437 | $ | 33,981 | $ | 32,848 | ||||||||||
Cash and cash equivalents were $31.4 billion at the end of 2008, $2.5 billion lower than the prior year, reflecting $2.7 billion of foreign exchange reductions from the strengthening of the U.S. dollar in 2008.
Cash and cash equivalents were $34.0 billion at the end of 2007, $5.7 billion higher than the prior year, reflecting a $4.6 billion increase due to the release of the restriction on the restricted cash and cash equivalents and $1.8 billion of positive foreign exchange effects from the weakening of the U.S. dollar in 2007. There were no restricted cash and cash equivalents at the end of 2007 (see note 3 and note 15)4).
Cash and cash equivalents were $28.2 billion at the end of 2006, comparable to the prior year, as a net reduction from operating, investing and financing activities was partly offset by $0.7 billion of positive foreign exchange effects from the weakening of the U.S. dollar in 2006. Including restricted cash and cash equivalents of $4.6 billion (see note 3 and note 15), total cash and cash equivalents were $32.8 billion at the end of 2006. Cash flows from operating, investing and financing activities are discussed below. For additional details, see the Consolidated Statement of Cash Flows.
Although the Corporation issuescould issue long-term debt from time to time and has access to short-term liquidity, internally generated funds cover the majority of its financial requirements. The management of cash that may be temporarily available as surplus to the Corporation’s immediate needs is carefully controlled both to optimize returns on cash balances, and to ensure that it is secure and readily available to meet the Corporation’s cash requirements.requirements and to optimize returns on the cash balances.
To support cash flows in future periods the Corporation will need to continually find and develop new fields, and continue to develop and apply new technologies and recovery processes to existing fields, in order to maintain or increase production. After a period of production at plateau rates, it is the nature of oil and gas fields eventually to produce at declining rates for the remainder of their economic life. Averaged over all the Corporation’s existing oil and gas fields and without new projects, ExxonMobil’s production is expected to decline at approximately 6 percent per year, consistent with recent historical performance. Decline rates can vary widely by individual field due to a number of factors, including, but not limited to, the type of reservoir, fluid properties, recovery mechanisms, and age of the field. Furthermore, the Corporation’s net interest in production for individual fields can vary with price and contractual terms.
The Corporation has long been successful at offsetting the effects of natural field decline through disciplined investments and anticipates similar results in the future. Projects are in progress or planned to increase production capacity. However, these volume increases are subject to a variety of risks including project start-up timing, operational outages, reservoir performance, crude oil and natural gas prices, weather events, and regulatory changes. The Corporation’s cash flows are also highly dependent on crude oil and natural gas prices.
The Corporation’s financial strength, as evidenced by its AAA/Aaa debt rating, enables it to make large, long-term capital expenditures. Capital and exploration expenditures in 20072008 were $20.9$26.1 billion, reflecting the Corporation’s continued active investment program. The Corporation expects spending in theannual expenditures to range from $25 billion to $30 billion for the next several years. Actual spending could vary depending on the progress of individual projects. The Corporation has a large and diverse portfolio of development projects and exploration opportunities, which helps mitigate the overall political and technical risks of the Corporation’s Upstream segment and associated cash flow. Further, due to its financial strength, debt capacity and diverse portfolio of opportunities, the risk associated with failure or delay of any single project would not have a significant impact on the Corporation’s liquidity or ability to generate sufficient cash flows for operations and its fixed commitments. The purchase and sale of oil and gas properties have not had a significant impact on the amount or timing of cash flows from operating activities.
A11A12
MANAGEMENT’S DISCUSSION AND ANALYSIS OF FINANCIAL CONDITION AND RESULTS OF OPERATIONS
Cash Flow from Operating Activities
2008
Cash provided by operating activities totaled $59.7 billion in 2008, a $7.7 billion increase from 2007. The major source of funds was net income of $45.2 billion, adjusted for the noncash provision of $12.4 billion for depreciation and depletion, both of which increased. The net effects of lower prices and the timing of collection of accounts receivable and of payments of accounts and other payables and of income taxes payable added to cash provided by operating activities.
2007
Cash provided by operating activities totaled $52.0 billion in 2007, a $2.7 billion increase from 2006. The major source of funds was net income of $40.6 billion, adjusted for the noncash provision of $12.3 billion for depreciation and depletion, both of which increased.
2006
Cash provided by operating activities totaled $49.3 billion in 2006, a $1.1 billion increase from 2005. The major source of funds was net income of $39.5 billion, adjusted for the noncash provision of $11.4 billion for depreciation and depletion, both of which increased. The net timing effects of receipts of notes and accounts receivable, payments of accounts and other payables and contributions to pension funds in 2006 provided a partial offset.
Cash Flow from Investing Activities
2008
Cash used in investing activities netted to $15.5 billion in 2008, $5.8 billion higher than in 2007. Spending for property, plant and equipment of $19.3 billion in 2008 increased $3.9 billion from 2007. Proceeds from the sales of subsidiaries, investments and property, plant and equipment of $6.0 billion in 2008 compared to $4.2 billion in 2007, the increase reflecting the sale of the German natural gas transportation business in 2008. Cash used in investing activities in 2008 was higher due to the absence of the $4.6 billion positive cash flow in 2007 from the release of the restriction on the restricted cash and cash equivalents. Net cash used for investments and advances and the change in marketable securities was $1.0 billion lower in 2008.
2007
Cash used in investing activities netted to $9.7 billion in 2007, $4.5 billion lower than in 2006. Spending for property, plant and equipment of $15.4 billion in 2007 was comparable to the prior year. Proceeds from the sales of subsidiaries, investments and property, plant and equipment of $4.2 billion in 2007 increased $1.1 billion, reflecting a higher level of asset sales in the Downstream business. Additions from the release of the restriction on the restricted cash and cash equivalents were $4.6 billion. Net investments and advances and net additions to marketable securities were $1.3 billion higher in 2007.
2006
Cash used in investing activities totaled $14.2 billion in 2006, $4.0 billion higher than 2005. Spending for property, plant and equipment increased $1.6 billion. Proceeds from the sales of subsidiaries, investments and property, plant and equipment of $3.1 billion in 2006 decreased $3.0 billion, reflecting a lower level of asset sales and the absence of almost $1.4 billion from the sale of the Corporation’s interest in Sinopec in 2005.
Cash Flow from Financing Activities
2008
Cash used in financing activities was $44.0 billion in 2008, an increase of $5.7 billion from 2007, reflecting a higher level of purchases of ExxonMobil shares. Dividend payments on common shares increased to $1.55 per share from $1.37 per share and totaled $8.1 billion, a pay-out of 18 percent. Total consolidated short-term and long-term debt decreased $0.2 billion to $9.4 billion at year-end 2008.
Shareholders’ equity decreased $8.8 billion in 2008, to $113.0 billion. Net income of $45.2 billion, reduced by distributions to ExxonMobil shareholders of $8.1 billion of dividends and $32.0 billion of purchases of shares of ExxonMobil stock to reduce shares outstanding, added to shareholders’ equity. Shareholders’ equity, and net assets and liabilities, decreased $6.8 billion, representing the foreign exchange translation effects of generally weaker foreign currencies at the end of 2008 on ExxonMobil’s operations outside the United States. The change in the funded status of the postretirement benefits reserves in 2008 lowered shareholders’ equity by $5.1 billion.
During 2008, Exxon Mobil Corporation purchased 434 million shares of its common stock for the treasury at a gross cost of $35.7 billion. These purchases were to reduce the number of shares outstanding and to offset shares issued in conjunction with company benefit plans and programs. Shares outstanding were reduced by 7.5 percent from 5,382 million at the end of 2007 to 4,976 million at the end of 2008. Purchases were made in both the open market and through negotiated transactions. Purchases may be increased, decreased or discontinued at any time without prior notice.
2007
Cash used in financing activities was $38.3 billion, an increase of $2.1 billion from 2006, reflecting a higher level of purchases of ExxonMobil shares. Dividend payments on common shares increased to $1.37 per share from $1.28 per share and totaled $7.6 billion, a payout of 19 percent. Total consolidated short-term and long-term debt increased $1.2 billion to $9.6 billion at year-end 2007.
Shareholders’ equity increased $7.9 billion in 2007, to $121.8 billion, reflecting $40.6 billion of net income reduced by distributions to ExxonMobil shareholders of $7.6 billion of dividends and $28.0 billion of purchases of shares of ExxonMobil stock to reduce shares outstanding. Shareholders’ equity, and net assets and liabilities, increased $4.2 billion, representing the foreign exchange translation effects of stronger foreign currencies at the end of 2007 on ExxonMobil’s operations outside the United States.
During 2007, Exxon Mobil Corporation purchased 386 million shares of its common stock for the treasury at a gross cost of $31.8 billion. These purchases were to reduce the number of shares outstanding and to offset shares issued in conjunction with company benefit plans and programs. Shares outstanding were reduced by 6.1 percent from 5,729 million at the end of 2006 to 5,382 million at the end of 2007. Purchases were made in both the open market and through negotiated transactions. Purchases may be increased, decreased or discontinued at any time without prior notice.
2006
Cash used in financing activities was $36.2 billion, an increase of $9.3 billion from 2005, reflecting a higher level of purchases of ExxonMobil shares. Dividend payments on common shares increased to $1.28 per share from $1.14 per share and totaled $7.6 billion, a payout of 19 percent. Total consolidated short-term and long-term debt increased $0.3 billion to $8.3 billion at year-end 2006.
Shareholders’ equity increased $2.7 billion in 2006, to $113.8 billion, reflecting $39.5 billion of net income reduced by distributions to ExxonMobil shareholders of $7.6 billion of dividends and $25.0 billion of purchases of shares of ExxonMobil stock to reduce shares outstanding. Shareholders’ equity, and net assets and liabilities, increased $2.8 billion, representing the foreign exchange translation effects of stronger foreign currencies at the end of 2006 on ExxonMobil’s operations outside the United States. Recognition of the “Postretirement benefits reserves adjustment” under Financial Accounting Standard No. 158 (see note 16) reduced shareholders’ equity by $6.5 billion.
During 2006, Exxon Mobil Corporation purchased 451 million shares of its common stock for the treasury at a gross cost of $29.6 billion. These purchases were to reduce the number of shares outstanding and to offset shares issued in conjunction with company benefit plans and programs. Shares outstanding were reduced by 6.6 percent from 6,133 million at the end of 2005 to 5,729 million at the end of 2006. Purchases were made in both the open market and through negotiated transactions.
A12A13
MANAGEMENT’S DISCUSSION AND ANALYSIS OF FINANCIAL CONDITION AND RESULTS OF OPERATIONS
Commitments
Set forth below is information about the outstanding commitments of the Corporation’s consolidated subsidiaries at December 31, 2007.2008. It combines data from the Consolidated Balance Sheet and from individual notes to the Consolidated Financial Statements.
| Payments Due by Period | Payments Due by Period | |||||||||||||||||||||||||||
Commitments | Note Reference Number | 2008 | 2009- 2012 | 2013 and Beyond | Total | Note Reference Number | 2009 | 2010- 2013 | 2014 and Beyond | Total | ||||||||||||||||||
| (millions of dollars) | (millions of dollars) | |||||||||||||||||||||||||||
Long-term debt (1) | 13 | $ | — | $ | 2,910 | $ | 4,273 | $ | 7,183 | 13 | $ | — | $ | 3,175 | $ | 3,850 | $ | 7,025 | ||||||||||
– Due in one year (2) | 318 | — | — | 318 | 368 | — | — | 368 | ||||||||||||||||||||
Asset retirement obligations (3) | 8 | 307 | 1,182 | 3,652 | 5,141 | 8 | 360 | 1,474 | 3,518 | 5,352 | ||||||||||||||||||
Pension and other postretirement obligations (4) | 16 | 1,392 | 3,654 | 7,851 | 12,897 | 16 | 5,502 | 3,718 | 12,338 | 21,558 | ||||||||||||||||||
Operating leases (5) | 10 | 1,994 | 5,358 | 2,564 | 9,916 | 10 | 2,278 | 6,126 | 2,784 | 11,188 | ||||||||||||||||||
Unconditional purchase obligations (6) | 15 | 490 | 1,497 | 778 | 2,765 | 15 | 456 | 1,161 | 654 | 2,271 | ||||||||||||||||||
Take-or-pay obligations (7) | 956 | 2,851 | 2,369 | 6,176 | 1,125 | 4,067 | 4,821 | 10,013 | ||||||||||||||||||||
Firm capital commitments (8) | 7,290 | 6,332 | 1,512 | 15,134 | 9,937 | 9,131 | 1,778 | 20,846 | ||||||||||||||||||||
This table excludes commodity purchase obligations (volumetric commitments but no fixed or minimum price) which are resold shortly after purchase, either in an active, highly liquid market or under long-term, unconditional sales contracts with similar pricing terms. Examples include long-term, noncancelable LNG and natural gas purchase commitments and commitments to purchase refinery products at market prices. Inclusion of such commitments would not be meaningful in assessing liquidity and cash flow, because these purchases will be offset in the same periods by cash received from the related sales transactions. The table also excludes net unrecognized tax benefits totaling $4.5$5.0 billion as of December 31, 2007,2008, because the Corporation is unable to make reasonably reliable estimates of the timing of cash settlements with the respective taxing authorities. Further details on the unrecognized tax benefits can be found in note 18, Income, Sales-Based and Other Taxes.
Notes:
| (1) | Includes capitalized lease obligations of |
| (2) | The amount due in one year is included in notes and loans payable of |
| (3) | The |
| (4) | The amount by which the benefit obligations exceeded the fair value of fund assets for certain U.S. and non-U.S. pension and other postretirement plans at year end. The payments by period include expected contributions to funded pension plans in |
| (5) | Minimum commitments for operating leases, shown on an undiscounted basis, cover drilling equipment, tankers, service stations and other properties. |
| (6) | Unconditional purchase obligations (UPOs) are those long-term commitments that are noncancelable and that third parties have used to secure financing for the facilities that will provide the contracted goods or services. The undiscounted obligations of |
| (7) | Take-or-pay obligations are noncancelable, long-term commitments for goods and services other than UPOs. The undiscounted obligations of |
| (8) | Firm commitments related to capital projects, shown on an undiscounted basis, totaled approximately |
Guarantees
The Corporation and certain of its consolidated subsidiaries were contingently liable at December 31, 2007,2008, for $5,148$7,847 million, primarily relating to guarantees for notes, loans and performance under contracts (note 15). Included in this amount were guarantees by consolidated affiliates of $4,591$6,102 million, representing ExxonMobil’s share of obligations of certain equity companies. The below-mentioned guarantees are not reasonably likely to have a material effect on the Corporation’s financial condition, changes in financial condition, revenues or expenses, results of operations, liquidity, capital expenditures or capital resources.
| Dec. 31, 2007 | |||||||||
| Equity Company Obligations | Other Third-Party Obligations | Total | |||||||
| (millions of dollars) | |||||||||
Total guarantees | $ | 4,591 | $ | 557 | $ | 5,148 | |||
| Dec. 31, 2008 | |||||||||
| Equity Company Obligations | Other Third-Party Obligations | Total | |||||||
| (millions of dollars) | |||||||||
Total guarantees | $ | 6,102 | $ | 1,745 | $ | 7,847 | |||
A13A14
MANAGEMENT’S DISCUSSION AND ANALYSIS OF FINANCIAL CONDITION AND RESULTS OF OPERATIONS
Financial Strength
On December 31, 2007,2008, unused credit lines for short-term financing totaled approximately $5.7$5.3 billion (note 5).
The table below shows the Corporation’s fixed-charge coverage and consolidated debt-to-capital ratios. The data demonstrate the Corporation’s creditworthiness. Throughout this period, the Corporation’s long-term debt securities maintained the top credit rating from both Standard & Poor’s (AAA) and Moody’s (Aaa), a rating it has sustained for 8990 years.
| 2007 | 2006 | 2005 | 2008 | 2007 | 2006 | |||||||
Fixed-charge coverage ratio (times) | 49.9 | 46.3 | 50.2 | 52.2 | 49.9 | 46.3 | ||||||
Debt to capital (percent) | 7.1 | 6.6 | 6.5 | 7.4 | 7.1 | 6.6 | ||||||
Net debt to capital (percent) | (24.0) | (20.4) | (22.0) | (23.0) | (24.0) | (20.4) | ||||||
Credit rating | AAA/Aaa | AAA/Aaa | AAA/Aaa | AAA/Aaa | AAA/Aaa | AAA/Aaa |
Management views the Corporation’s financial strength, as evidenced by the above financial ratios and other similar measures, to be a competitive advantage of strategic importance. The Corporation’s sound financial position gives it the opportunity to access the world’s capital markets in the full range of market conditions, and enables the Corporation to take on large, long-term capital commitments in the pursuit of maximizing shareholder value.
The Corporation makes limited use of derivative instruments, which are discussed in note 12.
Litigation and Other Contingencies
Litigation
As discussed in note 15, a number of lawsuits, including class actions, were brought in various courts against Exxon Mobil Corporation and certain of its subsidiaries relating to the accidental release of crude oil from the tanker Exxon Valdez in 1989. All the compensatory claims have been resolved and paid. All of the punitive damage claims were consolidated in the civil trial that began in 1994. The first judgment fromOn June 25, 2008, the United States District Court for the District of Alaska in the amount of $5 billion was vacated by the United States Court of Appeals for the Ninth Circuit as being excessive under the Constitution. The second judgment in the amount of $4 billion was vacated by the Ninth Circuit panel without argument and sent back for the District Court to reconsider in light of the recent U.S. Supreme Court decision inCampbell v. State Farm. The most recent District Court judgment forvacated the $2.5 billion punitive damages was for $4.5 billion plus interest and wasdamage award previously entered in January 2004. The Corporation posted a $5.4 billion letter of credit. ExxonMobil and the plaintiffs appealed this decision to the Ninth Circuit, which ruled on December 22, 2006, that the award be reduced to $2.5 billion. On January 12, 2007, ExxonMobil petitionedby the Ninth Circuit Court of Appeals for a rehearing en banc of its appeal. On May 23, 2007, with two dissenting opinions, the Ninth Circuit determined not to re-hear ExxonMobil’s appeal before the full court. ExxonMobil filed a petition for writ of certiorari to the U.S. Supreme Court on August 20, 2007. On October 29, 2007, the U.S. Supreme Court granted ExxonMobil’s petition for a writ of certiorari. Oral argument was held on February 27, 2008. While it is reasonably possible that a liability for punitive damages may have been incurred from the Exxon Valdez grounding, it is not possible to predict the ultimate outcome or to reasonably estimate any such potential liability.
In December 2000, a jury in the 15th Judicial Circuit Court of Montgomery County, Alabama, returned a verdict against the Corporation in a dispute over royalties in the amount of $88 million in compensatory damages and $3.4 billion in punitive damages in the case ofExxon Corporation v. State of Alabama, et al. The verdict was upheld by the trial court in May 2001. In December 2002, the Alabama Supreme Court vacated the $3.5 billion jury verdict. The case was retried and in November 2003, a state district court jury in Montgomery, Alabama, returned a verdict against Exxon Mobil Corporation. The verdict included $63.5 million in compensatory damages and $11.8 billion in punitive damages. In March 2004, the district court judge reduced the amount of punitive damages to $3.5 billion. ExxonMobil appealed the decision to the Alabama Supreme Court. On November 1, 2007, the Alabama Supreme Court reversed the trial court’s fraud judgment and instructed the district court to enter judgment for ExxonMobil on the fraud claim, eliminating the punitive damage award. The Court also ruled in ExxonMobil’s favor on some of the disputed lease issues, reducing the compensatory award to $52 million plus interest. Following the Alabama Supreme Court’s decision, an appeal bond was canceled and the collateral was subsequently released.
In 2001, a Louisiana state court jury awarded compensatory damages of $56 million and punitive damages of $1 billion to a landowner for damage caused by a third party that leased the property from the landowner. The third party provided pipe cleaning and storage services for the Corporation and other entities. The Louisiana Fourth Circuit Court of Appeals reduced the punitive damage award to $112 million in 2005. The Corporation appealed this decision to the Louisiana Supreme Court which, in March 2006, refused to hear the appeal. ExxonMobil has fully accrued and paid the compensatory and punitive damage awards. The Corporation appealed the punitive damage award to the U.S. Supreme Court, which on February 26, 2007, vacated the judgment and remanded the case to the Louisiana FourthCircuit Court with an instruction that punitive damages in the case may not exceed a maximum amount of $507.5 million. Exxon Mobil Corporation recorded an after-tax charge of $290 million in the second quarter of 2008, reflecting the maximum amount of the punitive damages. The parties have filed briefs in the Ninth Circuit Court of Appeals for reconsiderationon the issue of post-judgment interest and recovery of costs. Exxon Mobil Corporation recorded an after-tax charge of $170 million in lightthe third quarter of 2008, reflecting its estimate of the recent U.S. Supreme Court decision inWilliams v. Phillip Morris USA. On August 8, 2007, the Fourth Circuit issued its decision on remand and declined to reduce the punitive damage award. On November 16, 2007, the Louisiana Supreme Court denied ExxonMobil’s writ for reviewresolution of the Fourth Circuit’s decision. ExxonMobil has appealed to the U.S. Supreme Court.those issues.
A14
Based on a consideration of all relevant facts and circumstances, the Corporation does not believe the ultimate outcome of any currently pending lawsuit against ExxonMobil will have a materially adverse effect upon the Corporation’s operations or financial condition. There are no events or uncertainties beyond those already included in reported financial information that would indicate a material change in future operating results or financial condition.
Other Contingencies
In accordance with a nationalization decree issued by Venezuela’s president in February 2007, by May 1, 2007, a subsidiary of the Venezuelan National Oil Company (PdVSA) assumed the operatorship of the Cerro Negro Heavy Oil Project. This Project had been operated and owned by ExxonMobil affiliates holding a 41.67 percent ownership interest in the Project. The decree also required conversion of the Cerro Negro Project into a “mixed enterprise” and an increase in PdVSA’s or one of its affiliate’s ownership interest in the Project, with the stipulation that if ExxonMobil refused to accept the terms for the formation of the mixed enterprise within a specified period of time, the government would “directly assume the activities” carried out by the joint venture. ExxonMobil refused to accede to the terms proffered by PdVSA,the government, and on June 27, 2007, the government expropriated ExxonMobil’s 41.67 percent interest in the Cerro Negro Project.
To date, discussions with Venezuelan authorities have not resulted in an agreement on the amount of compensation to be paid to ExxonMobil. On September 6, 2007, affiliates of ExxonMobil filed a Request for Arbitration with the International Centre for Settlement of Investment Disputes. An affiliate of ExxonMobil has also filed an arbitration under the rules of the International Chamber of Commerce against PdVSA and a PdVSA affiliate for breach of their contractual obligations under certain Cerro Negro Project agreements. At this time, the net impact of this matter on the Corporation’s consolidated financial results cannot be reasonably estimated. However, the Corporation does not expect the resolution to have a material effect upon the Corporation’s operations or financial condition. At the time the assets were expropriated, ExxonMobil’s remaining net book investment in Cerro Negro producing assets wasis about $750 million.
CAPITAL AND EXPLORATION EXPENDITURES
| 2007 | 2006 | 2008 | 2007 | |||||||||||||||||||||
| U.S. | Non-U.S. | U.S. | Non-U.S. | U.S. | Non-U.S. | U.S. | Non-U.S. | |||||||||||||||||
| (millions of dollars) | (millions of dollars) | |||||||||||||||||||||||
Upstream(1) | $ | 2,212 | $ | 13,512 | $ | 2,486 | $ | 13,745 | $ | 3,334 | $ | 16,400 | $ | 2,212 | $ | 13,512 | ||||||||
Downstream | 1,128 | 2,175 | 824 | 1,905 | 1,636 | 1,893 | 1,128 | 2,175 | ||||||||||||||||
Chemical | 360 | 1,422 | 280 | 476 | 441 | 2,378 | 360 | 1,422 | ||||||||||||||||
Other | 44 | — | 130 | 9 | 61 | — | 44 | — | ||||||||||||||||
Total | $ | 3,744 | $ | 17,109 | $ | 3,720 | $ | 16,135 | $ | 5,472 | $ | 20,671 | $ | 3,744 | $ | 17,109 | ||||||||
| (1) | Exploration expenses included. |
Capital and exploration expenditures in 20072008 were $20.9$26.1 billion, reflecting the Corporation’s continued active investment program. The Corporation expects annual expenditures to range from $25 billion to $30 billion for the next several years. Actual spending could vary depending on the progress of individual projects.
Upstream spending of $15.7$19.7 billion in 20072008 was down 3up 26 percent from 2006,2007, mainly due to timing ofincreased project implementation and relatedexploration expenditures. During the past three years, Upstream capital and exploration expenditures averaged $15.5$17.2 billion. The majority of these expenditures are on development projects, which typically take two to four years from the time of recording proved undeveloped reserves to the start of production from those reserves. The percentage of proved developed reserves has remained relatively stable over the past five years at over 60 percent of total proved reserves, indicating that proved reserves are consistently moved from undeveloped to developed status. Capital and exploration expenditures are not tracked by the undeveloped and developed proved reserve categories. Capital investments in the
A15
MANAGEMENT’S DISCUSSION AND ANALYSIS OF FINANCIAL CONDITION AND RESULTS OF OPERATIONS
Downstream totaled $3.3$3.5 billion in 2007,2008, an increase of $0.6$0.2 billion from 2006, as a result of new investment in China and2007, due to higher environmental expenditures. Chemical 20072008 capital expenditures of $1.8$2.8 billion were up $1.0 billion from 20062007 due to increased investment in Singapore and ChinaAsia Pacific to meet Asia Pacific demand growth.
| 2007 | 2006 | 2005 | 2008 | 2007 | 2006 | |||||||||||||||||||
| (millions of dollars) | (millions of dollars) | |||||||||||||||||||||||
Income taxes | $ | 29,864 | $ | 27,902 | $ | 23,302 | $ | 36,530 | $ | 29,864 | $ | 27,902 | ||||||||||||
Sales-based taxes | 31,728 | 30,381 | 30,742 | 34,508 | 31,728 | 30,381 | ||||||||||||||||||
All other taxes and duties | 44,091 | 42,393 | 44,571 | 45,223 | 44,091 | 42,393 | ||||||||||||||||||
Total | $ | 105,683 | $ | 100,676 | $ | 98,615 | $ | 116,261 | $ | 105,683 | $ | 100,676 | ||||||||||||
Effective income tax rate | 44 | % | 43 | % | 41 | % | 47 | % | 44 | % | 43 | % | ||||||||||||
2008
Income, sales-based and all other taxes totaled $116.3 billion in 2008, an increase of $10.6 billion or 10 percent from 2007. Income tax expense, both current and deferred, was $36.5 billion, $6.7 billion higher than 2007, reflecting higher pre-tax income in 2008. A higher share of total income from the non-U.S. Upstream segment in 2008 increased the effective tax rate to 47 percent compared to 44 percent in 2007. Sales-based and all other taxes and duties of $79.7 billion in 2008 increased $3.9 billion from 2007, reflecting higher prices.
2007
Income, sales-based and all other taxes totaled $105.7 billion in 2007, an increase of $5.0 billion or 5 percent from 2006. Income tax expense, both current and deferred, was $29.9 billion, $2.0 billion higher than 2006, reflecting higher pre-tax income in 2007. The effective tax rate was 44 percent in 2007, compared to 43 percent in 2006. Sales-based and all other taxes and duties of $75.8 billion in 2007 increased $3.0 billion from 2006, reflecting higher prices.
2006
Income, sales-based and all other taxes and duties totaled $100.7 billion in 2006, an increase of $2.1 billion or 2 percent from 2005. Income tax expense, both current and deferred, was $27.9 billion, $4.6 billion higher than 2005, reflecting higher pre-tax income in 2006. The effective tax rate was 43 percent in 2006, compared to 41 percent in 2005. During both periods, the Corporation continued to benefit from the favorable resolution of tax-related issues. Sales-based and all other taxes and duties of $72.8 billion in 2006 decreased $2.5 billion from 2005, reflecting the tax impact of net reporting of purchases and sales of inventory with the same counterparty, only partly offset by the effects of higher prices.
A15
MANAGEMENT’S DISCUSSION AND ANALYSIS OF FINANCIAL CONDITION AND RESULTS OF OPERATIONS
Environmental Expenditures
| 2007 | 2006 | 2008 | 2007 | |||||||||
| (millions of dollars) | (millions of dollars) | |||||||||||
Capital expenditures | $ | 1,525 | $ | 1,081 | $ | 2,485 | $ | 1,525 | ||||
Other expenditures | 2,272 | 2,127 | 2,730 | 2,272 | ||||||||
Total | $ | 3,797 | $ | 3,208 | $ | 5,215 | $ | 3,797 | ||||
Throughout ExxonMobil’s businesses, new and ongoing measures are taken to prevent and minimize the impact of our operations on air, water and ground. These include a significant investment in refining infrastructure and technology to manufacture clean fuels as well as projects to reduce nitrogen oxide and sulfur oxide emissions and expenditures for asset retirement obligations. ExxonMobil’s 20072008 worldwide environmental expenditures for all such preventative and remediation steps, including ExxonMobil’s share of equity company expenditures, were about $3.8$5.2 billion. The total cost for such activities is expected to remain in this range in 20082009 and 20092010 (with capital expenditures approximately 4550 percent of the total).
Environmental Liabilities
The Corporation accrues environmental liabilities when it is probable that obligations have been incurred and the amounts can be reasonably estimated. This policy applies to assets or businesses currently owned or previously disposed. ExxonMobil has accrued liabilities for probable environmental remediation obligations at various sites, including multiparty sites where the U.S. Environmental Protection Agency has identified ExxonMobil as one of the potentially responsible parties. The involvement of other financially responsible companies at these multiparty sites could mitigate ExxonMobil’s actual joint and several liability exposure. At present, no individual site is expected to have losses material to ExxonMobil’s operations or financial condition. Consolidated company provisions made in 20072008 for environmental liabilities were $432$507 million ($350432 million in 2006)2007) and the balance sheet reflects accumulated liabilities of $884 million as of December 31, 2008, and $916 million as of December 31, 2007, and $864 million as of December 31, 2006.2007.
Asset Retirement Obligations
The fair values of asset retirement obligations are recorded as liabilities on a discounted basis when they are incurred, which is typically at the time assets are installed, with an offsetting amount booked as additions to property, plant and equipment ($113195 million for 2007)2008). Over time, the liabilities are accreted for the increase in their present value, with this effect included in expenses ($322335 million in 2007)2008). Consolidated company expenditures for asset retirement obligations in 20072008 were $352$258 million and the ending balance of the obligations recorded on the balance sheet at December 31, 2007,2008, totaled $5,141$5,352 million.
MARKET RISKS, INFLATION AND OTHER UNCERTAINTIES
Worldwide Average Realizations(1) | 2007 | 2006 | 2005 | 2008 | 2007 | 2006 | ||||||||||||
Crude oil and NGL ($/barrel) | $ | 66.02 | $ | 58.34 | $ | 48.23 | $ | 89.32 | $ | 66.02 | $ | 58.34 | ||||||
Natural gas ($/kcf) | 5.29 | 6.08 | 5.96 | 7.54 | 5.29 | 6.08 | ||||||||||||
| (1) | Consolidated subsidiaries. |
Crude oil, natural gas, petroleum product and chemical prices have fluctuated in response to changing market forces. The impacts of these price fluctuations on earnings from Upstream, Downstream and Chemical operations have varied. In the Upstream, based on the 2007 worldwide production levels, a $1 per barrel change in the weighted-average realized price of oil would have approximately a $400$375 million annual after-tax effect on Upstream consolidated plus equity company earnings. Similarly, a $0.10 per kcf change in the worldwide average gas realization would have approximately a $200$175 million annual after-tax effect on Upstream consolidated plus equity company earnings. For any given period, the extent of actual benefit or detriment will be dependent on the price movements of individual types of crude oil, taxes and other government take impacts, price adjustment lags in long-term gas contracts, and crude and gas production volumes. Accordingly, changes in benchmark prices for crude oil and natural gas only provide a broad indicatorindicators of changes in the earnings experienced in any particular period.
A16
In the very competitive downstream and chemical environments, earnings are primarily determined by margin capture rather than absolute price levels of products sold. Refining margins are a function of the difference between what a refiner pays for its raw materials (primarily crude oil) and the market prices for the range of products produced. These prices in turn depend on global and regional supply/demand balances, inventory levels, refinery operations, import/export balances and weather.
The global energy markets can give rise to extended periods in which market conditions are adverse to one or more of the Corporation’s businesses. Such conditions, along with the capital-intensive nature of the industry and very long lead times associated with many of our projects, underscore the importance of maintaining a strong financial position. Management views the Corporation’s financial strength, including the AAA and Aaa ratings of its long-term debt securities by Standard & Poor’s and Moody’s, as a competitive advantage.
In general, segment results are not dependent on the ability to sell and/or purchase products to/from other segments. Instead, where such sales take place, they are the result of efficiencies and competitive advantages of integrated refinery/chemical complexes. Additionally, intersegment sales are at market-based prices. The products bought and sold between segments can also be acquired in worldwide markets that have substantial liquidity, capacity and transportation capabilities. About 40 percent of the Corporation’s intersegment sales are crude oil produced by the Upstream and sold to the Downstream. Other intersegment sales include those between refineries and chemical plants related to raw materials, feedstocks and finished products.
A16
Although price levels of crude oil and natural gas may rise or fall significantly over the short to medium term due to political events, OPEC actions and other factors, industry economics over the long term will continue to be driven by market supply and demand. Accordingly, the Corporation tests the viability of all of its assetsinvestments over a broad range of future prices. The Corporation’s assessment is that its operations will continue to be successful in a variety of market conditions. This is the outcome of disciplined investment and asset management programs. Investment opportunities are tested against a variety of market conditions, including low-price scenarios. As a result, investments that would succeed only in highly favorable price environments are screened out of the investment plan.
The Corporation has had an active asset management program in which underperforming assets are either improved to acceptable levels or considered for divestment. The asset management program involvesincludes a disciplined, regular review to ensure that all assets are contributing to the Corporation’s strategic and financial objectives. The result has been the creation ofis an efficient capital base, and has meant that the Corporation has seldom been requiredhad to write down the carrying value of assets, even during periods of low commodity prices.
Risk Management
The Corporation’s size, strong capital structure, geographic diversity and the complementary nature of the Upstream, Downstream and Chemical businesses reduce the Corporation’s enterprise-wide risk from changes in interest rates, currency rates and commodity prices. As a result, the Corporation makes limited use of derivative instruments to mitigate the impact of such changes. The Corporation does not engage in speculative derivative activities or derivative trading activities nor does it use derivatives with leveraged features. The Corporation maintains a system of controls that includes the authorization, reporting and monitoring of derivative activity. The Corporation’s limited derivative activities pose no material credit or market risks to ExxonMobil’s operations, financial condition or liquidity. Note 12 summarizes the fair value of derivatives outstanding at year end and the gains or losses that have been recognized in net income.
The Corporation is exposed to changes in interest rates, primarily as a result ofon its short-term debt and the portion of long-term debt carryingthat carries floating interest rates. The impact of a 100-basis-point change in interest rates affecting the Corporation’s debt would not be material to earnings, cash flow or fair value. The Corporation’s cash balances exceeded total debt at year-end 20072008 and 2006.2007. During 2008, credit markets tightened and the global economy slowed. The Corporation is not dependent on the credit markets to fund current operations. However, some joint-venture partners are dependent on the credit markets, and their funding ability may impact the development pace of joint-venture projects.
The Corporation conducts business in many foreign currencies and is subject to exchange rate risk on cash flows related to sales, expenses, financing and investment transactions. The impacts of fluctuations in exchange rates on ExxonMobil’s geographically and functionally diverse operations are varied and often offsetting in amount. The Corporation makes limited use of currency exchange contracts, commodity forwards, swaps and futures contracts to mitigate the impact of changes in currency values and commodity prices. Exposures related to the Corporation’s limited use of the above contracts are not material.
Inflation and Other Uncertainties
The general rate of inflation in mostmany major countries of operation has beenincreased in 2008 versus the relatively low rates in recent years, and the associated impact on non-energy costs has generally been counteredmitigated by cost reductions from efficiency and productivity improvements. Increased global demand for certain services and materials has resulted in higher operating and capital costs in recent years. The Corporation continuesworks to mitigate these effectscounter upward pressure on costs through its economies of scale in global procurement and its efficient project management practices.
A17
MANAGEMENT’S DISCUSSION AND ANALYSIS OF FINANCIAL CONDITION AND RESULTS OF OPERATIONS
RECENTLY ISSUED STATEMENTS OF FINANCIAL ACCOUNTING STANDARDS
Fair Value Measurements
In September 2006, the Financial Accounting Standards Board (FASB) issued FASB Statement No. 157 (FAS 157), “Fair Value Measurements.” FAS 157 defines fair value, establishes a framework for measuring fair value when an entity is required to use a fair value measure for recognition or disclosure purposes and expands the disclosures about fair value measurements.
FAS 157 must be adopted by the Corporation no later than January 1, 2008, for all financial assets and liabilities that are measured at fair value and nonfinancial assets and liabilities that are remeasured at fair value at least annually. FAS 157 must be adopted no later than January 1, 2009, for nonfinancial assets and liabilities that are not remeasured at fair value at least annually. The Corporation does not expect the adoption of FAS 157 to have a material impact on the Corporation’s financial statements.
Noncontrolling Interests in Consolidated Financial Statements
In December 2007, the Financial Accounting Standards Board (FASB) issued FASB issued Statement No. 160 (FAS 160), “Noncontrolling Interests in Consolidated Financial Statements – an Amendment of ARB No. 51.” FAS 160 changes the accounting and reporting for minority interests, which will be recharacterized as non-controllingnoncontrolling interests and classified as a component of equity.
FAS 160 must be adopted by the Corporation no later than January 1, 2009. FAS 160 requires retrospective adoption of the presentation and disclosure requirements for existing minority interests. All other requirements of FAS 160 will be applied prospectively. The Corporation does not expect the adoption of FAS 160 to have a material impact on the Corporation’s financial statements.
Revisions to the Earnings Per Share Calculation
A17
MANAGEMENT’S DISCUSSION AND ANALYSIS OF FINANCIAL CONDITION AND RESULTS OF OPERATIONSdividends should be included in the basic Earnings Per Share (EPS) calculation. The FSP will be effective for first quarter 2009 reporting. The implementation of this standard for the Corporation will result in changes in the calculation of basic and diluted EPS that are not expected to be material. Prior-year EPS numbers will be adjusted retrospectively on a consistent basis. This standard will not affect the consolidated financial position or results of operations.
The Corporation’s accounting and financial reporting fairly reflect its straightforward business model involving the extracting, refining and marketing of hydrocarbons and hydrocarbon-based products. The preparation of financial statements in conformity with U.S. Generally Accepted Accounting Principles (GAAP) requires management to make estimates and judgments that affect the reported amounts of assets, liabilities, revenues and expenses and the disclosure of contingent assets and liabilities. The following summary provides further information about the critical accounting policies and the judgments that are made by the Corporation in the application of those policies.
Oil and Gas Reserves
Evaluations of oil and gas reserves are important to the effective management of Upstream assets. They are integral to making investment decisions about oil and gas properties such as whether development should proceed or enhanced recovery methods should be undertaken.proceed. Oil and gas reserve quantities are also used as the basis for calculating unit-of-production depreciation rates and for evaluating impairment. Oil and gas reserves include both proved and unproved reserves. Proved reserves are the estimated quantities of crude oil, natural gas and natural gas liquids that geological and engineering data demonstrate with reasonable certainty to be recoverable in future years from known reservoirs under existing economic and operating conditions; i.e., prices and costs as of the date the estimate is made. Unproved reserves are those with less than reasonable certainty of recoverability and include probable reserves. Probable reserves are reserves that are more likely to be recovered than not.
The estimation of proved reserves, which is based on the requirement of reasonable certainty, is an ongoing process based on rigorous technical evaluations, commercial and market assessment, and detailed analysis of well information such as flow rates and reservoir pressure declines. The estimation of proved reserves is controlled by the Corporation through long-standing approval guidelines. Reserve changes are made within a well-established, disciplined process driven by senior level geoscience and engineering professionals (assisted by a central reserves group with significant technical experience), culminating in reviews with and approval by senior management. Notably, the Corporation does not use specific quantitative reserve targets to determine compensation.
Key features of the reserves estimation process include:
rigorous peer-reviewed technical evaluations and analysis of well and field performance information (such as flow rates and reservoir pressure declines) and
a requirement that management make significant funding commitments toward the development of the reserves prior to reporting as proved.
Although the Corporation is reasonably certain that proved reserves will be produced, the timing and amount recovered can be affected by a number of factors including completion of development projects, reservoir performance, regulatory approvals and significant changes in long-term oil and gas price levels.
Proved reserves can be further subdivided into developed and undeveloped reserves. The percentage of proved developed reserves has remained relatively stable over the past five years at over 60 percent of total proved reserves (including both consolidated and equity company reserves), indicating that proved reserves are consistently moved from undeveloped to developed status. Over time, these undeveloped reserves will be reclassified to the developed category as new wells are drilled, existing wells are recompleted and/or facilities to collect and deliver the production from existing and future wells are installed. Major development projects typically take two to four years from the time of recording proved reserves to the start of production from these reserves.
The year-end reserves volumes as well as the reserves change categories shown in the proved reserves tables are calculated using December 31 prices and costs. These reserves quantities are also used in calculating unit-of-production depreciation rates and in calculating the standardized measure of discounted net cash flow. We understand that the use of December 31 prices and costs is intended to provide a point in time measure to calculate reserves and to enhance comparability between companies.
Regulations preclude However, the Corporation from showing in this document the reserves that are calculated in a manner that is consistent with the basis that the Corporation uses to make its investment decisions. The use of year-end prices for reserves estimation introduces short-term price volatility into the process, which
A18
is inconsistent with the long-term nature of the upstream business, since annual adjustments are required based on prices occurring on a single day. The Corporation believes that this approach is inconsistent withAs a result, the long-term nature of the upstream business where production from individual projects often spans multiple decades. The use of prices from a single date is not relevant to the investment decisions made by the Corporation and annual variations in reserves based on such year-end prices are not of consequence in how the business is actually managed.Corporation.
Revisions can include upward or downward changes in previously estimated volumes of proved reserves for existing fields due to the evaluation or re-evaluation of (1) already available geologic, reservoir or production data, (2) new geologic, reservoir or production data or (3) changes in year-end prices and costs that are used in the determination of reserves. This category can also include changes associated with the performance of improved recovery projects and significant changes in either development strategy or production equipment/facility capacity.
The Corporation uses the “successful efforts” method to account for its exploration and production activities. Under this method, costs are accumulated on a field-by-field basis with certain exploratory expenditures and exploratory dry holes being expensed as incurred. Costs of productive wells and development dry holes are capitalized and amortized on the unit-of-production method. The Corporation uses this accounting policy instead of the “full cost” method because it provides a more timely accounting of the success or failure of the Corporation’s exploration and production activities. If the full cost method were used, all costs would be capitalized and depreciated on a country-by-country basis. The capitalized costs would be subject to an impairment test by country. The full cost method would tend to delay the expense recognition of unsuccessful projects.
A18
Impact of Oil and Gas Reserves on Depreciation.The calculation of unit-of-production depreciation is a critical accounting estimate that measures the depreciation of upstream assets. It is the ratio of actual volumes produced to total proved developed reserves (those proved reserves recoverable through existing wells with existing equipment and operating methods), applied to the asset cost. The volumes produced and asset cost are known and, while proved developed reserves have a high probability of recoverability, they are based on estimates that are subject to some variability. While the revisions the Corporation has made in the past are an indicator of variability, they have had a very small impact on the unit-of-production rates because they have been small compared to the large reserves base.
Impact of Oil and Gas Reserves and Prices on Testing for Impairment.Proved oil and gas properties held and used by the Corporation are reviewed for impairment whenever events or circumstances indicate that the carrying amounts may not be recoverable. Assets are grouped at the lowest level for which there are identifiable cash flows that are largely independent of the cash flows of other groups of assets.
The Corporation estimates the future undiscounted cash flows of the affected properties to judge the recoverability of carrying amounts. In general, analyses are based on proved reserves. Where probable reserves exist, an appropriately risk-adjusted amount of these reserves may be included in the impairment evaluation. An asset would be impaired if the undiscounted cash flows were less than its carrying value. Impairments are measured by the amount by which the carrying value exceeds its fair value.
The Corporation performs asset valuation analyses on an ongoing basis as a part of its asset management program. These analyses monitor the performance of assets against corporate objectives. They also assist the Corporation in assessing whether the carrying amounts of any of its assets may not be recoverable. In addition to estimating oil and gas reserve volumes in conducting these analyses, it is also necessary to estimate future oil and gas prices. Trigger events for impairment evaluation include a significant decrease in current and projected prices or reserve volumes, an accumulation of project costs significantly in excess of the amount originally expected, and historical and current operating losses.
In general, the Corporation does not view temporarily low oil and gas prices as a trigger event for conducting the impairment tests. The markets for crude oil and natural gas have a history of significant price volatility. Although prices will occasionally drop significantly, industry prices over the long term will continue to be driven by market supply and demand. On the supply side, industry production from mature fields is declining, but this is being offset by production from new discoveries and field developments. OPEC production policies also have an impact on world oil supplies. The demand side is largely a function of global economic growth. The relative growth/decline in supply versus demand will determine industry prices over the long term and these cannot be accurately predicted. Accordingly, any impairment tests that the Corporation performs make use of the Corporation’s price assumptions developed in the annual planning and budgeting process for the crude oil and natural gas markets, petroleum products and chemicals. These are the same price assumptions that are used for capital investment decisions. Volumes are based on individual field production profiles, which are updated annually. Cash flow estimates for impairment testing exclude the use of derivative instruments.
Supplemental information regarding oil and gas results of operations, capitalized costs and reserves is provided following the notes to consolidated financial statements. The standardized measure of discounted future cash flows is based on the year-end price applied for all future years, as required under Statement of Financial Accounting Standards No. 69 (FAS 69), “Disclosure about Oil and Gas Producing Activities.” Future prices used for any impairment tests will vary from the one used in the FAS 69 disclosure and could be lower or higher for any given year.
A19
MANAGEMENT’S DISCUSSION AND ANALYSIS OF FINANCIAL CONDITION AND RESULTS OF OPERATIONS
Suspended Exploratory Well Costs
The Corporation carries as an asset exploratory well costs when the well has found a sufficient quantity of reserves to justify its completion as a producing well and where the Corporation is making sufficient progress assessing the reserves and the economic and operating viability of the project. Exploratory well costs not meeting these criteria are charged to expense. Assessing whether a project has made sufficient progress is a subjective area and requires careful consideration of the relevant facts and circumstances. The facts and circumstances that support continued capitalization of suspended wells as of year-end 20072008 are disclosed in note 9 to the financial statements.
A19
MANAGEMENT’S DISCUSSION AND ANALYSIS OF FINANCIAL CONDITION AND RESULTS OF OPERATIONS
Consolidations
The Consolidated Financial Statements include the accounts of those subsidiaries that the Corporation controls. They also include the Corporation’s share of the undivided interest in certain upstream assets and liabilities. Amounts representing the Corporation’s percentage interest in the underlying net assets of other significant affiliates that it does not control, but exercises significant influence, are included in “Investments, advances and long-term receivables”; the Corporation’s share of the net income of these companies is included in the Consolidated Statement of Income caption “Income from equity affiliates.” The accounting for these non-consolidated companies is referred to as the equity method of accounting.
Majority ownership is normally the indicator of control that is the basis on which subsidiaries are consolidated. However, certain factors may indicate that a majority-owned investment is not controlled and therefore should be accounted for using the equity method of accounting. These factors occur where the minority shareholders are granted by law or by contract substantive participating rights. These include the right to approve operating policies, expense budgets, financing and investment plans and management compensation and succession plans.
Additional disclosures of summary balance sheet and income information for those subsidiaries accounted for under the equity method of accounting can be found in note 6.
Investments in companies that are partially owned by the Corporation are integral to the Corporation’s operations. In some cases they serve to balance worldwide risks and in others they provide the only available means of entry into a particular market or area of interest. The other parties who also have an equity interest in these companies are either independent third parties or host governments that share in the business results according to their percentage ownership. The Corporation does not invest in these companies in order to remove liabilities from its balance sheet. In fact, the Corporation has long been on record supporting an alternative accounting method that would require each investor to consolidate its percentage share of all assets and liabilities in these partially owned companies rather than only its percentage in the net equity. This method of accounting for investments in partially owned companies is not permitted by GAAP except where the investments are in the direct ownership of a share of upstream assets and liabilities. However, for purposes of calculating return on average capital employed, which is not covered by GAAP standards, the Corporation includes its share of debt of these partially owned companies in the determination of average capital employed.
Pension Benefits
The Corporation and its affiliates sponsor approximately 100 defined benefit (pension) plans in about 50 countries. The funding arrangement for each plan depends on the prevailing practices and regulations of the countries where the Corporation operates. Pension and Other Postretirement Benefits (note 16) provides details on pension obligations, fund assets and pension expense.
Some of these plans (primarily non-U.S.) provide pension benefits that are paid directly by their sponsoring affiliates out of corporate cash flow rather than a separate pension fund. Book reserves are established for these plans because tax conventions and regulatory practices do not encourage advance funding. The portion of the pension cost attributable to employee service is expensed as services are rendered. The portion attributable to the increase in pension obligations due to the passage of time is expensed over the term of the obligations, which ends when all benefits are paid. The primary difference in pension expense for unfunded versus funded plans is that pension expense for funded plans also includes a credit for the expected long-term return on fund assets.
For funded plans, including manythose in the United States, pension obligations are financed in advance through segregated assets or insurance arrangements. These plans are managed in compliance with the requirements of governmental authorities and meet or exceed required funding levels as measured by relevant actuarial and government standards at the mandated measurement dates. In determining liabilities and required contributions, these standards often require approaches and assumptions that differ from those used for accounting purposes.
The Corporation will continue to make contributions to these funded plans as necessary. All defined-benefit pension obligations, regardless of the funding status of the underlying plans, are fully supported by the financial strength of the Corporation or the respective sponsoring affiliate.
Pension accounting requires explicit assumptions regarding, among others, the long-term expected earnings rate on fund assets, the discount rate for the benefit obligations and the long-term rate for future salary increases. Pension assumptions are reviewed annually by outside actuaries and senior management. These assumptions are adjusted only as appropriate to reflect changes in market rates and outlook. For example, theThe long-term expected earnings rate on U.S. pension plan assets in 20072008 was 9.0 percent. This compares to anThe 10-year and 20-year actual rate of return over the past decade of 10 percent.returns on U.S. pension plan assets are 5 percent and 9 percent, respectively. The Corporation establishes the long-term expected rate of return by developing a forward-looking, long-term return assumption for each pension fund asset class, taking into account factors such as the expected real return
A20
for the specific asset class and inflation. A single, long-term rate of return is then calculated as the weighted average of the target asset allocation and the long-term return assumption for each asset class. A worldwide reduction of 0.5 percent in the long-term rate of return on assets would increase annual pension expense by approximately $140$90 million before tax.
A20
Differences between actual returns on fund assets and the long-term expected return are not recognized in pension expense in the year that the difference occurs. Such differences are deferred, along with other actuarial gains and losses, and are amortized into pension expense over the expected remaining service life of employees.
Litigation Contingencies
A variety of claims have been made against the Corporation and certain of its consolidated subsidiaries in a number of pending lawsuits. Management has regular litigation reviews, including updates from corporate and outside counsel, to assess the need for accounting recognition or disclosure of these contingencies. The status of significant claims is summarized in note 15.
GAAP requires that liabilities for contingencies be recorded when it is probable that a liability has been incurred by the date of the balance sheet and that the amount can be reasonably estimated. These amounts are not reduced by amounts that may be recovered under insurance or claims against third parties, but undiscounted receivables from insurers or other third parties may be accrued separately. The Corporation revises such accruals in light of new information. For contingencies where an unfavorable outcome is reasonably possible and which are significant, the Corporation discloses the nature of the contingency and, where feasible, an estimate of the possible loss.
Significant management judgment is required related to contingent liabilities and the outcome of litigation because both are difficult to predict. However, the Corporation has been successful in defending litigation in the past. Payments have not had a materially adverse effect on operations or financial condition. In the Corporation’s experience, large claims often do not result in large awards. Large awards are often reversed or substantially reduced as a result of appeal or settlement.
Tax Contingencies
The Corporation is subject to income taxation in many jurisdictions around the world. Significant management judgment is required in the accounting for income tax contingencies and tax disputes because the outcomes are often difficult to predict.
GAAP requires recognition and measurement of uncertain tax positions that the Corporation has taken or expects to take in its income tax returns. The benefit of an uncertain tax position can only be recognized in the financial statements if management concludes that it is more likely than not that the position will be sustained with the tax authorities. For a position that is likely to be sustained, the benefit recognized in the financial statements is measured at the largest amount that is greater than 50 percent likely of being realized. A reserve is established for the difference between a position taken in an income tax return and the amount recognized in the financial statements. The Corporation’s unrecognized tax benefits and a description of open tax years are summarized in note 18.
Foreign Currency Translation
The method of translating the foreign currency financial statements of the Corporation’s international subsidiaries into U.S. dollars is prescribed by GAAP. Under these principles, it is necessary to select the functional currency of these subsidiaries. The functional currency is the currency of the primary economic environment in which the subsidiary operates. Management selects the functional currency after evaluating this economic environment. Downstream and Chemical operations use the local currency, except in countries with a history of high inflation (primarily in Latin America) and Singapore, which uses the U.S. dollar because it predominantly sells into the U.S. dollar export market. Upstream operations also use the local currency as the functional currency, except where crude and natural gas production is predominantly sold in the export market in U.S. dollars. Operations using the U.S. dollar as their functional currency include Malaysia, Indonesia, Angola, Nigeria, Equatorial Guinea,are primarily in Asia, West Africa, Russia and the Middle East.
Factors considered by management when determining the functional currency for a subsidiary include: the currency used for cash flows related to individual assets and liabilities; the responsiveness of sales prices to changes in exchange rates; the history of inflation in the country; whether sales are into local markets or exported; the currency used to acquire raw materials, labor, services and supplies; sources of financing; and significance of intercompany transactions.
A21
MANAGEMENT’S REPORT ON INTERNAL CONTROL OVER FINANCIAL REPORTING
Management, including the Corporation’s chief executive officer, principal financial officer, and principal accounting officer, is responsible for establishing and maintaining adequate internal control over the Corporation’s financial reporting. Management conducted an evaluation of the effectiveness of internal control over financial reporting based on thecriteria established inInternal Control – Integrated Framework issued by the Committee of Sponsoring Organizations of the Treadway Commission. Based on this evaluation, management concluded that Exxon Mobil Corporation’s internal control over financial reporting was effective as of December 31, 2007.2008.
PricewaterhouseCoopers LLP, an independent registered public accounting firm, audited the effectiveness of the Corporation’s internal control over financial reporting as of December 31, 2007,2008, as stated in their report included in the Financial Section of this report.

|   | 
| ||
| Rex W. Tillerson | Donald D. Humphreys | Patrick T. Mulva | ||
| Chief Executive Officer | Sr. Vice President and Treasurer
| Vice President and Controller | ||
| (Principal Financial Officer) | (Principal Accounting Officer) |
REPORT OF INDEPENDENT REGISTERED PUBLIC ACCOUNTING FIRM


To the Shareholders of Exxon Mobil Corporation:
In our opinion, the consolidated financial statements listed under Item 8 of the Form 10-K present fairly, in all material respects, the financial position of Exxon Mobil Corporation and its subsidiaries at December 31, 2007,2008, and 2006,2007, and the results of their operations and their cash flows for each of the three years in the period ended December 31, 2007,2008, in conformity with accounting principles generally accepted in the United States of America. Also in our opinion, the Corporation maintained, in all material respects, effective internal control over financial reporting as of December 31, 2007,2008, based on criteria established inInternal Control – Integrated Framework issued by the Committee of Sponsoring Organizations of the Treadway Commission (COSO). The Corporation’s management is responsible for these financial statements, for maintaining effective internal control over financial reporting and for its assessment of the effectiveness of internal control over financial reporting, included in Management’s Report on Internal Control over Financial Reporting. Our responsibility is to express opinions on these financial statements and on the Corporation’s internal control over financial reporting based on our integrated audits. We conducted our audits in accordance with the standards of the Public Company Accounting Oversight Board (United States). Those standards require that we plan and perform the audits to obtain reasonable assurance about whether the financial statements are free of material misstatement and whether effective internal control over financial reporting was maintained in all material respects. Our audits of the financial statements included examining, on a test basis, evidence supporting the amounts and disclosures in the financial statements, assessing the accounting principles used and significant estimates made by management, and evaluating the overall financial statement presentation. Our audit of internal control over financial reporting included obtaining an understanding of internal control over financial reporting, assessing the risk that a material weakness exists, and testing and evaluating the design and operating effectiveness of internal control based on the assessed risk. Our audits also included performing such other procedures as we considered necessary in the circumstances. We believe that our audits provide a reasonable basis for our opinions.
A22
As discussed in Note 218 to the consolidated financial statements, the Corporation changed its method of accounting for uncertainty in income taxes in 2007.
A company’s internal control over financial reporting is a process designed to provide reasonable assurance regarding the reliability of financial reporting and the preparation of financial statements for external purposes in accordance with generally accepted accounting principles. A company’s internal control over financial reporting includes those policies and procedures that (i) pertain to the maintenance of records that, in reasonable detail, accurately and fairly reflect the transactions and dispositions of the assets of the company; (ii) provide reasonable assurance that transactions are recorded as necessary to permit preparation of financial statements in accordance with generally accepted accounting principles, and that receipts and expenditures of the company are being made only in accordance with authorizations of management and directors of the company; and (iii) provide reasonable assurance regarding prevention or timely detection of unauthorized acquisition, use, or disposition of the company’s assets that could have a material effect on the financial statements.
Because of its inherent limitations, internal control over financial reporting may not prevent or detect misstatements. Also, projections of any evaluation of effectiveness to future periods are subject to the risk that controls may become inadequate because of changes in conditions, or that the degree of compliance with the policies or procedures may deteriorate.


Dallas, Texas
February 28, 200827, 2009
A23
CONSOLIDATED STATEMENT OF INCOME
| Note Reference Number | 2007 | 2006 | 2005 | Note Reference Number | 2008 | 2007 | 2006 | |||||||||||||||
| (millions of dollars) | (millions of dollars) | |||||||||||||||||||||
Revenues and other income | ||||||||||||||||||||||
Sales and other operating revenue(1) (2) | $ | 390,328 | $ | 365,467 | $ | 358,955 | ||||||||||||||||
Sales and other operating revenue(1) | $ | 459,579 | $ | 390,328 | $ | 365,467 | ||||||||||||||||
Income from equity affiliates | 6 | 8,901 | 6,985 | 7,583 | 6 | 11,081 | 8,901 | 6,985 | ||||||||||||||
Other income | 5,323 | 5,183 | 4,142 | 6,699 | 5,323 | 5,183 | ||||||||||||||||
Total revenues and other income | $ | 404,552 | $ | 377,635 | $ | 370,680 | $ | 477,359 | $ | 404,552 | $ | 377,635 | ||||||||||
Costs and other deductions | ||||||||||||||||||||||
Crude oil and product purchases | $ | 199,498 | $ | 182,546 | $ | 185,219 | $ | 249,454 | $ | 199,498 | $ | 182,546 | ||||||||||
Production and manufacturing expenses | 31,885 | 29,528 | 26,819 | 37,905 | 31,885 | 29,528 | ||||||||||||||||
Selling, general and administrative expenses | 14,890 | 14,273 | 14,402 | 15,873 | 14,890 | 14,273 | ||||||||||||||||
Depreciation and depletion | 12,250 | 11,416 | 10,253 | 12,379 | 12,250 | 11,416 | ||||||||||||||||
Exploration expenses, including dry holes | 1,469 | 1,181 | 964 | 1,451 | 1,469 | 1,181 | ||||||||||||||||
Interest expense | 400 | 654 | 496 | 673 | 400 | 654 | ||||||||||||||||
Sales-based taxes(1) | 18 | 31,728 | 30,381 | 30,742 | 18 | 34,508 | 31,728 | 30,381 | ||||||||||||||
Other taxes and duties | �� | 18 | 40,953 | 39,203 | 41,554 | 18 | 41,719 | 40,953 | 39,203 | |||||||||||||
Income applicable to minority and preferred interests | 1,005 | 1,051 | 799 | |||||||||||||||||||
Income applicable to minority interests | 1,647 | 1,005 | 1,051 | |||||||||||||||||||
Total costs and other deductions | $ | 334,078 | $ | 310,233 | $ | 311,248 | $ | 395,609 | $ | 334,078 | $ | 310,233 | ||||||||||
Income before income taxes | $ | 70,474 | $ | 67,402 | $ | 59,432 | $ | 81,750 | $ | 70,474 | $ | 67,402 | ||||||||||
Income taxes | 18 | 29,864 | 27,902 | 23,302 | 18 | 36,530 | 29,864 | 27,902 | ||||||||||||||
Net income | $ | 40,610 | $ | 39,500 | $ | 36,130 | $ | 45,220 | $ | 40,610 | $ | 39,500 | ||||||||||
Net income per common share (dollars) | 11 | $ | 7.36 | $ | 6.68 | $ | 5.76 | 11 | $ | 8.78 | $ | 7.36 | $ | 6.68 | ||||||||
Net income per common share – assuming dilution (dollars) | 11 | $ | 7.28 | $ | 6.62 | $ | 5.71 | 11 | $ | 8.69 | $ | 7.28 | $ | 6.62 | ||||||||
| (1) | Sales and other operating revenue includes sales-based taxes of $34,508 million for 2008, $31,728 million for 2007 and $30,381 million for |
| (2) |
The information in the Notes to Consolidated Financial Statements is an integral part of these statements.
A24
| Note Reference Number | Dec. 31 2007 | Dec. 31 2006 | Note Reference Number | Dec. 31 2008 | Dec. 31 2007 | |||||||||||||||
| (millions of dollars) | (millions of dollars) | |||||||||||||||||||
Assets | ||||||||||||||||||||
Current assets | ||||||||||||||||||||
Cash and cash equivalents | $ | 33,981 | $ | 28,244 | $ | 31,437 | $ | 33,981 | ||||||||||||
Cash and cash equivalents – restricted | 3, 15 | — | 4,604 | |||||||||||||||||
Marketable securities | 519 | — | 570 | 519 | ||||||||||||||||
Notes and accounts receivable, less estimated doubtful amounts | 5 | 36,450 | 28,942 | 5 | 24,702 | 36,450 | ||||||||||||||
Inventories | ||||||||||||||||||||
Crude oil, products and merchandise | 3 | 8,863 | 8,979 | 3 | 9,331 | 8,863 | ||||||||||||||
Materials and supplies | 2,226 | 1,735 | 2,315 | 2,226 | ||||||||||||||||
Prepaid taxes and expenses | 3,924 | 3,273 | ||||||||||||||||||
Other current assets | 3,911 | 3,924 | ||||||||||||||||||
Total current assets | $ | 85,963 | $ | 75,777 | $ | 72,266 | $ | 85,963 | ||||||||||||
Investments, advances and long-term receivables | 7 | 28,194 | 23,237 | 7 | 28,556 | 28,194 | ||||||||||||||
Property, plant and equipment, at cost, less accumulated depreciation and depletion | 8 | 120,869 | 113,687 | 8 | 121,346 | 120,869 | ||||||||||||||
Other assets, including intangibles, net | 7,056 | 6,314 | 5,884 | 7,056 | ||||||||||||||||
Total assets | $ | 242,082 | $ | 219,015 | $ | 228,052 | $ | 242,082 | ||||||||||||
Liabilities | ||||||||||||||||||||
Current liabilities | ||||||||||||||||||||
Notes and loans payable | 5 | $ | 2,383 | $ | 1,702 | 5 | $ | 2,400 | $ | 2,383 | ||||||||||
Accounts payable and accrued liabilities | 5 | 45,275 | 39,082 | 5 | 36,643 | 45,275 | ||||||||||||||
Income taxes payable | 10,654 | 8,033 | 10,057 | 10,654 | ||||||||||||||||
Total current liabilities | $ | 58,312 | $ | 48,817 | $ | 49,100 | $ | 58,312 | ||||||||||||
Long-term debt | 13 | 7,183 | 6,645 | 13 | 7,025 | 7,183 | ||||||||||||||
Postretirement benefits reserves | 16 | 13,278 | 13,931 | 16 | 20,729 | 13,278 | ||||||||||||||
Deferred income tax liabilities | 18 | 22,899 | 20,851 | 18 | 19,726 | 22,899 | ||||||||||||||
Other long-term obligations | 14,366 | 11,123 | 13,949 | 14,366 | ||||||||||||||||
Equity of minority and preferred shareholders in affiliated companies | 4,282 | 3,804 | ||||||||||||||||||
Equity of minority interests | 4,558 | 4,282 | ||||||||||||||||||
Total liabilities | $ | 120,320 | $ | 105,171 | $ | 115,087 | $ | 120,320 | ||||||||||||
Commitments and contingencies | 15 | 15 | ||||||||||||||||||
Shareholders’ equity | ||||||||||||||||||||
Common stock without par value | $ | 4,933 | $ | 4,786 | $ | 5,314 | $ | 4,933 | ||||||||||||
(9,000 million shares authorized, 8,019 million shares issued) | ||||||||||||||||||||
Earnings reinvested | 228,518 | 195,207 | 265,680 | 228,518 | ||||||||||||||||
Accumulated other comprehensive income | ||||||||||||||||||||
Cumulative foreign exchange translation adjustment | 7,972 | 3,733 | 1,146 | 7,972 | ||||||||||||||||
Postretirement benefits reserves adjustment | (5,983 | ) | (6,495 | ) | (11,077 | ) | (5,983 | ) | ||||||||||||
Common stock held in treasury (2,637 million shares in 2007 and 2,290 million shares in 2006) | (113,678 | ) | (83,387 | ) | ||||||||||||||||
Common stock held in treasury (3,043 million shares in 2008 and 2,637 million shares in 2007) | (148,098 | ) | (113,678 | ) | ||||||||||||||||
Total shareholders’ equity | $ | 121,762 | $ | 113,844 | $ | 112,965 | $ | 121,762 | ||||||||||||
Total liabilities and shareholders’ equity | $ | 242,082 | $ | 219,015 | $ | 228,052 | $ | 242,082 | ||||||||||||
The information in the Notes to Consolidated Financial Statements is an integral part of these statements.
A25
CONSOLIDATED STATEMENT OF SHAREHOLDERS’ EQUITY
| 2007 | 2006 | 2005 | Note Reference Number | 2008 | 2007 | 2006 | ||||||||||||||||||||||||||||||||||||||||||||
| Note Reference Number | Shareholders’ Equity | Comprehensive Income | Shareholders’ Equity | Comprehensive Income(1) | Shareholders’ Equity | Comprehensive Income | Shareholders’ Equity | Comprehensive Income | Shareholders’ Equity | Comprehensive Income | Shareholders’ Equity | Comprehensive Income(1) | ||||||||||||||||||||||||||||||||||||||
| (millions of dollars) | (millions of dollars) | |||||||||||||||||||||||||||||||||||||||||||||||||
Common stock | ||||||||||||||||||||||||||||||||||||||||||||||||||
At beginning of year | $ | 4,786 | $ | 4,477 | $ | 4,053 | $ | 4,933 | $ | 4,786 | $ | 4,477 | ||||||||||||||||||||||||||||||||||||||
Restricted stock amortization | 531 | 480 | 356 | 618 | 531 | 480 | ||||||||||||||||||||||||||||||||||||||||||||
Tax benefits related to stock-based awards | 113 | 169 | 224 | 315 | �� | 113 | 169 | |||||||||||||||||||||||||||||||||||||||||||
Cumulative effect of accounting change | 2 | (55 | ) | — | — | 18 | — | (55 | ) | — | ||||||||||||||||||||||||||||||||||||||||
Other | (442 | ) | (340 | ) | (156 | ) | (552 | ) | (442 | ) | (340 | ) | ||||||||||||||||||||||||||||||||||||||
At end of year | $ | 4,933 | $ | 4,786 | $ | 4,477 | $ | 5,314 | $ | 4,933 | $ | 4,786 | ||||||||||||||||||||||||||||||||||||||
Earnings reinvested | ||||||||||||||||||||||||||||||||||||||||||||||||||
At beginning of year | 195,207 | 163,335 | 134,390 | 228,518 | 195,207 | 163,335 | ||||||||||||||||||||||||||||||||||||||||||||
Net income for the year | 40,610 | $ | 40,610 | 39,500 | $ | 39,500 | 36,130 | $ | 36,130 | 45,220 | $ | 45,220 | 40,610 | $ | 40,610 | 39,500 | $ | 39,500 | ||||||||||||||||||||||||||||||||
Cumulative effect of accounting change | 2 | 322 | — | — | 18 | — | 322 | — | ||||||||||||||||||||||||||||||||||||||||||
Dividends – common shares | (7,621 | ) | (7,628 | ) | (7,185 | ) | (8,058 | ) | (7,621 | ) | (7,628 | ) | ||||||||||||||||||||||||||||||||||||||
At end of year | $ | 228,518 | $ | 195,207 | $ | 163,335 | $ | 265,680 | $ | 228,518 | $ | 195,207 | ||||||||||||||||||||||||||||||||||||||
Accumulated other comprehensive income | ||||||||||||||||||||||||||||||||||||||||||||||||||
At beginning of year | (2,762 | ) | (1,279 | ) | 1,527 | 1,989 | (2,762 | ) | (1,279 | ) | ||||||||||||||||||||||||||||||||||||||||
Foreign exchange translation adjustment | 4,239 | 4,239 | 2,754 | 2,754 | (2,619 | ) | (2,619 | ) | (6,964 | ) | (6,964 | ) | 4,239 | 4,239 | 2,754 | 2,754 | ||||||||||||||||||||||||||||||||||
Adjustment for foreign exchange translation loss included in net income | 138 | 138 | — | — | — | — | ||||||||||||||||||||||||||||||||||||||||||||
Postretirement benefits reserves adjustment | 16 | (326 | ) | (326 | ) | (6,495 | ) | — | — | — | 16 | (5,853 | ) | (5,853 | ) | (326 | ) | (326 | ) | (6,495 | ) | — | ||||||||||||||||||||||||||||
Amortization of postretirement benefits reserves adjustment included in net periodic benefit costs | 16 | 838 | 838 | — | — | — | — | 16 | 759 | 759 | 838 | 838 | — | — | ||||||||||||||||||||||||||||||||||||
Minimum pension liability adjustment | — | — | 2,258 | 749 | 241 | 241 | — | — | — | — | 2,258 | 749 | ||||||||||||||||||||||||||||||||||||||
Reclassification adjustment for gain on sale of stock investment included in net income | — | — | — | — | (428 | ) | (428 | ) | ||||||||||||||||||||||||||||||||||||||||||
At end of year | $ | 1,989 | $ | (2,762 | ) | $ | (1,279 | ) | $ | (9,931 | ) | $ | 1,989 | $ | (2,762 | ) | ||||||||||||||||||||||||||||||||||
Total | $ | 45,361 | $ | 43,003 | $ | 33,324 | $ | 33,300 | $ | 45,361 | $ | 43,003 | ||||||||||||||||||||||||||||||||||||||
Common stock held in treasury | ||||||||||||||||||||||||||||||||||||||||||||||||||
At beginning of year | (83,387 | ) | (55,347 | ) | (38,214 | ) | (113,678 | ) | (83,387 | ) | (55,347 | ) | ||||||||||||||||||||||||||||||||||||||
Acquisitions, at cost | (31,822 | ) | (29,558 | ) | (18,221 | ) | (35,734 | ) | (31,822 | ) | (29,558 | ) | ||||||||||||||||||||||||||||||||||||||
Dispositions | 1,531 | 1,518 | 1,088 | 1,314 | 1,531 | 1,518 | ||||||||||||||||||||||||||||||||||||||||||||
At end of year | $ | (113,678 | ) | $ | (83,387 | ) | $ | (55,347 | ) | $ | (148,098 | ) | $ | (113,678 | ) | $ | (83,387 | ) | ||||||||||||||||||||||||||||||||
Shareholders’ equity at end of year | $ | 121,762 | $ | 113,844 | $ | 111,186 | $ | 112,965 | $ | 121,762 | $ | 113,844 | ||||||||||||||||||||||||||||||||||||||
| Share Activity | Share Activity | |||||||||||||||||||||||||||||||||||||||||||||||||
| 2007 | 2006 | 2005 | 2008 | 2007 | 2006 | |||||||||||||||||||||||||||||||||||||||||||||
| (millions of shares) | (millions of shares) | |||||||||||||||||||||||||||||||||||||||||||||||||
Common stock | ||||||||||||||||||||||||||||||||||||||||||||||||||
Issued | ||||||||||||||||||||||||||||||||||||||||||||||||||
At beginning of year | 8,019 | 8,019 | 8,019 | 8,019 | 8,019 | 8,019 | ||||||||||||||||||||||||||||||||||||||||||||
Issued | — | — | — | — | — | — | ||||||||||||||||||||||||||||||||||||||||||||
At end of year | 8,019 | 8,019 | 8,019 | 8,019 | 8,019 | 8,019 | ||||||||||||||||||||||||||||||||||||||||||||
Held in treasury | ||||||||||||||||||||||||||||||||||||||||||||||||||
At beginning of year | (2,290 | ) | (1,886 | ) | (1,618 | ) | (2,637 | ) | (2,290 | ) | (1,886 | ) | ||||||||||||||||||||||||||||||||||||||
Acquisitions | (386 | ) | (451 | ) | (311 | ) | (434 | ) | (386 | ) | (451 | ) | ||||||||||||||||||||||||||||||||||||||
Dispositions | 39 | 47 | 43 | 28 | 39 | 47 | ||||||||||||||||||||||||||||||||||||||||||||
At end of year | (2,637 | ) | (2,290 | ) | (1,886 | ) | (3,043 | ) | (2,637 | ) | (2,290 | ) | ||||||||||||||||||||||||||||||||||||||
Common shares outstanding at end of year | 5,382 | 5,729 | 6,133 | 4,976 | 5,382 | 5,729 | ||||||||||||||||||||||||||||||||||||||||||||
| (1) | Includes pre-FAS 158 adoption change in minimum pension liability. |
The information in the Notes to Consolidated Financial Statements is an integral part of these statements.
A26
CONSOLIDATED STATEMENT OF CASH FLOWS
| Note Reference Number | 2007 | 2006 | 2005 | Note Reference Number | 2008 | 2007 | 2006 | |||||||||||||||||||||
| (millions of dollars) | (millions of dollars) | |||||||||||||||||||||||||||
Cash flows from operating activities | ||||||||||||||||||||||||||||
Net income | ||||||||||||||||||||||||||||
Accruing to ExxonMobil shareholders | $ | 40,610 | $ | 39,500 | $ | 36,130 | $ | 45,220 | $ | 40,610 | $ | 39,500 | ||||||||||||||||
Accruing to minority and preferred interests | 1,005 | 1,051 | 799 | |||||||||||||||||||||||||
Accruing to minority interests | 1,647 | 1,005 | 1,051 | |||||||||||||||||||||||||
Adjustments for noncash transactions | ||||||||||||||||||||||||||||
Depreciation and depletion | 12,250 | 11,416 | 10,253 | 12,379 | 12,250 | 11,416 | ||||||||||||||||||||||
Deferred income tax charges/(credits) | 124 | 1,717 | (429 | ) | 1,399 | 124 | 1,717 | |||||||||||||||||||||
Postretirement benefits expense in excess of/(less than) payments | (1,314 | ) | (1,787 | ) | 254 | 57 | (1,314 | ) | (1,787 | ) | ||||||||||||||||||
Other long-term obligation provisions in excess of/(less than) payments | 1,065 | (666 | ) | 398 | (63 | ) | 1,065 | (666 | ) | |||||||||||||||||||
Dividends received greater than/(less than) equity in current earnings of equity companies | (714 | ) | (579 | ) | (734 | ) | 921 | (714 | ) | (579 | ) | |||||||||||||||||
Changes in operational working capital, excluding cash and debt | ||||||||||||||||||||||||||||
Reduction/(increase) – Notes and accounts receivable | (5,441 | ) | (181 | ) | (3,700 | ) | 8,641 | (5,441 | ) | (181 | ) | |||||||||||||||||
– Inventories | 72 | (1,057 | ) | (434 | ) | (1,285 | ) | 72 | (1,057 | ) | ||||||||||||||||||
– Prepaid taxes and expenses | 280 | (385 | ) | (7 | ) | |||||||||||||||||||||||
– Other current assets | (509 | ) | 280 | (385 | ) | |||||||||||||||||||||||
Increase/(reduction) – Accounts and other payables | 6,228 | 1,160 | 7,806 | (5,415 | ) | 6,228 | 1,160 | |||||||||||||||||||||
Net (gain) on asset sales | 4 | (2,217 | ) | (1,531 | ) | (1,980 | ) | 4 | (3,757 | ) | (2,217 | ) | (1,531 | ) | ||||||||||||||
All other items – net | 54 | 628 | (218 | ) | 490 | 54 | 628 | |||||||||||||||||||||
Net cash provided by operating activities | $ | 52,002 | $ | 49,286 | $ | 48,138 | $ | 59,725 | $ | 52,002 | $ | 49,286 | ||||||||||||||||
Cash flows from investing activities | ||||||||||||||||||||||||||||
Additions to property, plant and equipment | $ | (15,387 | ) | $ | (15,462 | ) | $ | (13,839 | ) | $ | (19,318 | ) | $ | (15,387 | ) | $ | (15,462 | ) | ||||||||||
Sales of subsidiaries, investments and property, plant and equipment | 4 | 4,204 | 3,080 | 6,036 | 4 | 5,985 | 4,204 | 3,080 | ||||||||||||||||||||
Decrease in restricted cash and cash equivalents | 3,15 | 4,604 | — | — | 4 | — | 4,604 | — | ||||||||||||||||||||
Additional investments and advances | (3,038 | ) | (2,604 | ) | (2,810 | ) | (2,495 | ) | (3,038 | ) | (2,604 | ) | ||||||||||||||||
Collection of advances | 391 | 756 | 343 | 574 | 391 | 756 | ||||||||||||||||||||||
Additions to marketable securities | (646 | ) | — | — | (2,113 | ) | (646 | ) | — | |||||||||||||||||||
Sales of marketable securities | 144 | — | — | 1,868 | 144 | — | ||||||||||||||||||||||
Net cash used in investing activities | $ | (9,728 | ) | $ | (14,230 | ) | $ | (10,270 | ) | $ | (15,499 | ) | $ | (9,728 | ) | $ | (14,230 | ) | ||||||||||
Cash flows from financing activities | ||||||||||||||||||||||||||||
Additions to long-term debt | $ | 592 | $ | 318 | $ | 195 | $ | 79 | $ | 592 | $ | 318 | ||||||||||||||||
Reductions in long-term debt | (209 | ) | (33 | ) | (81 | ) | (192 | ) | (209 | ) | (33 | ) | ||||||||||||||||
Additions to short-term debt | 1,211 | 334 | 377 | 1,067 | 1,211 | 334 | ||||||||||||||||||||||
Reductions in short-term debt | (809 | ) | (451 | ) | (687 | ) | (1,624 | ) | (809 | ) | (451 | ) | ||||||||||||||||
Additions/(reductions) in debt with less than 90-day maturity | (187 | ) | (95 | ) | (1,306 | ) | ||||||||||||||||||||||
Additions/(reductions) in debt with three months or less maturity | 143 | (187 | ) | (95 | ) | |||||||||||||||||||||||
Cash dividends to ExxonMobil shareholders | (7,621 | ) | (7,628 | ) | (7,185 | ) | (8,058 | ) | (7,621 | ) | (7,628 | ) | ||||||||||||||||
Cash dividends to minority interests | (289 | ) | (239 | ) | (293 | ) | (375 | ) | (289 | ) | (239 | ) | ||||||||||||||||
Changes in minority interests and sales/(purchases) of affiliate stock | (659 | ) | (493 | ) | (681 | ) | (419 | ) | (659 | ) | (493 | ) | ||||||||||||||||
Tax benefits related to stock-based awards | 369 | 462 | — | 333 | 369 | 462 | ||||||||||||||||||||||
Common stock acquired | (31,822 | ) | (29,558 | ) | (18,221 | ) | (35,734 | ) | (31,822 | ) | (29,558 | ) | ||||||||||||||||
Common stock sold | 1,079 | 1,173 | 941 | 753 | 1,079 | 1,173 | ||||||||||||||||||||||
Net cash used in financing activities | $ | (38,345 | ) | $ | (36,210 | ) | $ | (26,941 | ) | $ | (44,027 | ) | $ | (38,345 | ) | $ | (36,210 | ) | ||||||||||
Effects of exchange rate changes on cash | $ | 1,808 | $ | 727 | $ | (787 | ) | $ | (2,743 | ) | $ | 1,808 | $ | 727 | ||||||||||||||
Increase/(decrease) in cash and cash equivalents | $ | 5,737 | $ | (427 | ) | $ | 10,140 | $ | (2,544 | ) | $ | 5,737 | $ | (427 | ) | |||||||||||||
Cash and cash equivalents at beginning of year | 28,244 | 28,671 | 18,531 | 33,981 | 28,244 | 28,671 | ||||||||||||||||||||||
Cash and cash equivalents at end of year | $ | 33,981 | $ | 28,244 | $ | 28,671 | $ | 31,437 | $ | 33,981 | $ | 28,244 | ||||||||||||||||
The information in the Notes to Consolidated Financial Statements is an integral part of these statements.
A27
NOTES TO CONSOLIDATED FINANCIAL STATEMENTS
The accompanying consolidated financial statements and the supporting and supplemental material are the responsibility of the management of Exxon Mobil Corporation.
The Corporation’s principal business is energy, involving the worldwide exploration, production, transportation and sale of crude oil and natural gas (Upstream) and the manufacture, transportation and sale of petroleum products (Downstream). The Corporation is also a major worldwide manufacturer and marketer of petrochemicals (Chemical) and participates in electric power generation (Upstream).
The preparation of financial statements in conformity with U.S. Generally Accepted Accounting Principles (GAAP) requires management to make estimates that affect the reported amounts of assets, liabilities, revenues and expenses and the disclosure of contingent assets and liabilities. Actual results could differ from these estimates. Prior years’ data has been reclassified in certain cases to conform to the 20072008 presentation basis.
1.Summary1. Summary of Accounting Policies
Principles of Consolidation. The Consolidated Financial Statements include the accounts of those subsidiaries owned directly or indirectly with more than 50 percent of the voting rights held by the Corporation and for which other shareholders do not possess the right to participate in significant management decisions. They also include the Corporation’s share of the undivided interest in certain upstream assets and liabilities.
Amounts representing the Corporation’s percentage interest in the underlying net assets of other subsidiaries and less-than-majority-owned companies in which a significant ownership percentage interest is held are included in “Investments, advances and long-term receivables”; the Corporation’s share of the net income of these companies is included in the Consolidated Statement of Income caption “Income from equity affiliates.” The Corporation’s share of the cumulative foreign exchange translation adjustment for equity method investments is reported in the Consolidated Statement of Shareholders’ Equity. Evidence of loss in value that might indicate impairment of investments in companies accounted for on the equity method is assessed to determine if such evidence represents a loss in value of the Corporation’s investment that is other than temporary. Examples of key indicators include a history of operating losses, a negative earnings and cash flow outlook, significant downward revisions to oil and gas reserves, and the financial condition and prospects for the investee’s business segment or geographic region. If evidence of an other than temporary loss in fair value below carrying amount is determined, an impairment is recognized. In the absence of market prices for the investment, discounted cash flows are used to assess fair value.
Revenue Recognition. The Corporation generally sells crude oil, natural gas and petroleum and chemical products under short-term agreements at prevailing market prices. In some cases (e.g., natural gas), products may be sold under long-term agreements, with periodic price adjustments. In all cases, revenues are recognized when the products are delivered, which occurs when the customer has taken title and has assumed the risks and rewards of ownership, prices are fixed or determinable and collectibility is reasonably assured.
Revenues from the production of natural gas properties in which the Corporation has an interest with other producers are recognized on the basis of the Corporation’s net working interest. Differences between actual production and net working interest volumes are not significant.
Effective January 1, 2006, the Corporation adopted the Emerging Issues Task Force (EITF) consensus on Issue No. 04-13, “Accounting for Purchases and Sales of Inventory with the Same Counterparty.” The EITF concluded that purchases and sales of inventory with the same counterparty that are entered into in contemplation of one another should beare combined and recorded as exchanges measured at the book value of the item sold. In prior periods, the Corporation recorded certain crude oil, natural gas, petroleum product and chemical sales and purchases contemporaneously negotiated with the same counterparty as revenues and purchases. As a result of the EITF consensus, the Corporation’s accounts “Sales and other operating revenue,” “Crude oil and product purchases” and “Other taxes and duties” on the Consolidated Statement of Income were reduced prospectively from 2006 by associated amounts with no impact on net income. All operating segments were affected by this change, with the largest impact in the Downstream.
Sales-Based Taxes.The Corporation reports sales, excise and value-added taxes on sales transactions on a gross basis in the Consolidated Statement of Income (included in both revenues and costs). This gross reporting basis is footnoted on the Consolidated Statement of Income.
Derivative Instruments. The Corporation makes limited use of derivative instruments. The Corporation does not engage in speculative derivative activities or derivative trading activities nor does it use derivatives with leveraged features. When the Corporation does enter into derivative transactions, it is to offset exposures associated with interest rates, foreign currency exchange rates and hydrocarbon prices that arise from existing assets, liabilities and transactions.
The gains and losses resulting from changes in the fair value of derivatives are recorded in income. In some cases, the Corporation designates derivatives as fair value hedges, in which case the gains and losses are offset in income by the gains and losses arising from changes in the fair value of the underlying hedged items.
A28
Inventories. Crude oil, products and merchandise inventories are carried at the lower of current market value or cost (generally determined under the last-in, first-out method – LIFO). Inventory costs include expenditures and other charges (including depreciation) directly and indirectly incurred in bringing the inventory to its existing condition and location. Selling expenses and general and administrative expenses are reported as period costs and excluded from inventory cost. Inventories of materials and supplies are valued at cost or less.
Property, Plant and Equipment. Depreciation, depletion and amortization, based on cost less estimated salvage value of the asset, are primarily determined under either the unit-of-production method or the straight-line method, which is based on estimated asset service life taking obsolescence into consideration. Maintenance and repairs, including planned major maintenance, are expensed as incurred. Major renewals and improvements are capitalized and the assets replaced are retired.
Interest costs incurred to finance expenditures during the construction phase of multiyear projects are capitalized as part of the historical cost of acquiring the constructed assets. The project construction phase commences with the development of the detailed engineering design and ends when the constructed assets are ready for their intended use. Capitalized interest costs are included in property, plant and equipment and are depreciated over the service life of the related assets.
The Corporation uses the “successful efforts” method to account for its exploration and production activities. Under this method, costs are accumulated on a field-by-field basis with certain exploratory expenditures and exploratory dry holes being expensed as incurred. Costs of productive wells and development dry holes are capitalized and amortized on the unit-of-production method.
A28
The Corporation carries as an asset exploratory well costs when the well has found a sufficient quantity of reserves to justify its completion as a producing well and where the Corporation is making sufficient progress assessing the reserves and the economic and operating viability of the project. Exploratory well costs not meeting these criteria are charged to expense.
Acquisition costs of proved properties are amortized using a unit-of-production method, computed on the basis of total proved oil and gas reserves. Significant unproved properties are assessed for impairment individually and valuation allowances against the capitalized costs are recorded based on the estimated economic chance of success and the length of time that the Corporation expects to hold the properties. The cost of properties that are not individually significant are aggregated by groups and amortized over the average holding period of the properties of the groups. The valuation allowances are reviewed at least annually. Other exploratory expenditures, including geophysical costs, other dry hole costs and annual lease rentals, are expensed as incurred.
Unit-of-production depreciation is applied to property, plant and equipment, including capitalized exploratory drilling and development costs, associated with productive depletable extractive properties in the Upstream segment. Unit-of-production rates are based on the amount of proved developed reserves of oil, gas and other minerals that are estimated to be recoverable from existing facilities using current operating methods. Additional oil and gas to be obtained through the application of improved recovery techniques is included when, or to the extent that, the requisite commercial-scale facilities have been installed and the required wells have been drilled.
Under the unit-of-production method, oil and gas volumes are considered produced once they have been measured through meters at custody transfer or sales transaction points at the outlet valve on the lease or field storage tank.
Production costs are expensed as incurred. Production involves lifting the oil and gas to the surface and gathering, treating, field processing and field storage of the oil and gas. The production function normally terminates at the outlet valve on the lease or field production storage tank. Production costs are those incurred to operate and maintain the Corporation’s wells and related equipment and facilities. They become part of the cost of oil and gas produced. These costs, sometimes referred to as lifting costs, include such items as labor costs to operate the wells and related equipment; repair and maintenance costs on the wells and equipment; materials, supplies and energy costs required to operate the wells and related equipment; and administrative expenses related to the production activity.
Gains on sales of proved and unproved properties are only recognized when there is no uncertainty about the recovery of costs applicable to any interest retained or where there is no substantial obligation for future performance by the Corporation. Losses on properties sold are recognized when incurred or when the properties are held for sale and the fair value of the properties is less than the carrying value.
Proved oil and gas properties held and used by the Corporation are reviewed for impairment whenever events or changes in circumstances indicate that the carrying amounts may not be recoverable. Assets are grouped at the lowest level for which there are identifiable cash flows that are largely independent of the cash flows of other groups of assets.
The Corporation estimates the future undiscounted cash flows of the affected properties to judge the recoverability of carrying amounts. Cash flows used in impairment evaluations are developed using annually updated corporate plan investment evaluation assumptions for crude oil commodity prices and foreign currency exchange rates. Annual volumes are based on individual field production profiles, which are also updated annually. Prices for natural gas and other products are based on corporate plan assumptions developed annually by major region and also for investment evaluation purposes. Cash flow estimates for impairment testing exclude derivative instruments.
Impairment analyses are generally based on proved reserves. Where probable reserves exist, an appropriately risk-adjusted amount of these reserves may be included in the impairment evaluation. Impairments are measured by the amount the carrying value exceeds the fair value.
A29
NOTES TO CONSOLIDATED FINANCIAL STATEMENTS
Asset Retirement Obligations and Environmental Liabilities. The Corporation incurs retirement obligations for certain assets at the time they are installed. The fair values of these obligations are recorded as liabilities on a discounted basis. The costs associated with these liabilities are capitalized as part of the related assets and depreciated. Over time, the liabilities are accreted for the change in their present value.
Liabilities for environmental costs are recorded when it is probable that obligations have been incurred and the amounts can be reasonably estimated. These liabilities are not reduced by possible recoveries from third parties and projected cash expenditures are not discounted.
Foreign Currency Translation.The Corporation selects the functional reporting currency for its international subsidiaries based on the currency of the primary economic environment in which each subsidiary operates. Downstream and Chemical operations primarily use the local currency. However, the U.S. dollar is used in countries with a history of high inflation (primarily in Latin America) and Singapore, which predominantly sells into the U.S. dollar export market. Upstream operations which are relatively self-contained and integrated within a particular country, such as Canada, the United Kingdom, Norway and continental Europe, use the local currency. Some Upstream operations, primarily in Asia, West Africa, Russia and the Middle East, use the U.S. dollar because they predominantly sell crude and natural gas production into U.S. dollar-denominated markets. For all operations, gains or losses from remeasuring foreign currency transactions into the functional currency are included in income.
Share-Based Payments. The Corporation awards share-based compensation to employees in the form of restricted stock and restricted stock units. Compensation expense is measured by the market price of the restricted shares at the date of grant and is recognized in the income statement over the requisite service period of each award. See note 14, Incentive Program, for further details.
A29
NOTES TO CONSOLIDATED FINANCIAL STATEMENTS
2.Accounting2. Accounting Change for Uncertainty in Income TaxesFair Value Measurements
Effective January 1, 2007,2008, the Corporation adopted the Financial Accounting Standards Board’s (FASB) InterpretationStatement No. 48 (FIN 48)157 (FAS 157), “Accounting“Fair Value Measurements,” for Uncertaintyfinancial assets and liabilities that are measured at fair value and nonfinancial assets and liabilities that are measured at fair value on a recurring basis. FAS 157 defines fair value, establishes a framework for measuring fair value when an entity is required to use a fair value measure for recognition or disclosure purposes and expands the disclosures about fair value measurements. The initial application of FAS 157 is limited to the Corporation’s investments in Income Taxes.” FIN 48derivative instruments and some debt and equity securities. The fair value measurements for these instruments are based on quoted prices or observable market inputs. The value of these instruments is an interpretation of FASB Statement 109, “Accounting for Income Taxes,” and prescribes a comprehensive model for recognizing, measuring, presenting and disclosing inimmaterial to the Corporation’s financial statements, uncertain tax positionsand the related gains or losses from periodic measurement at fair value are de minimis. Effective January 1, 2009, FAS 157 is applicable to all nonfinancial assets and liabilities that the Corporation has taken or expects to take in its income tax returns. Upon the adoption of FIN 48, the Corporation recognized a transition gain of $267 million in shareholders’ equity. The gain reflected the recognition of several refund claims, partly offset by increased liability reserves. FIN 48 also resulted in a reclassification of amounts previously reported net on the balance sheet. The balance sheet reclassifications resulted in a $2.4 billion increase to investments, advances and long-term receivables, a $1.0 billion decrease to current liabilities, primarily income taxes payable, and a $3.1 billion increase to other long-term obligations. See note 18, Income, Sales-Based and Other Taxes, for additional disclosures.are measured at fair value.
3.Miscellaneous3. Miscellaneous Financial Information
Research and development costs totaled $847 million in 2008, $814 million in 2007 and $733 million in 2006 and $712 million in 2005.2006.
Net income included before-tax aggregate foreign exchange transaction gains of $54 million, $229 million and $278 million in 2008, 2007 and 2006, respectively, and losses of $138 million in 2005.respectively.
In 2008, 2007 2006 and 2005,2006, net income included gains of $341 million, $327 million $401 million and $215$401 million, respectively, attributable to the combined effects of LIFO inventory accumulations and draw-downs. The aggregate replacement cost of inventories was estimated to exceed their LIFO carrying values by $25.4$10.0 billion and $15.9$25.4 billion at December 31, 2007,2008, and 2006,2007, respectively.
Crude oil, products and merchandise as of year-end 20072008 and 20062007 consist of the following:
| 2007 | 2006 | |||||
| (billions of dollars) | ||||||
Petroleum products | $ | 3.8 | $ | 3.8 | ||
Crude oil | 2.6 | 2.8 | ||||
Chemical products | 2.1 | 2.1 | ||||
Gas/other | 0.4 | 0.3 | ||||
Total | $ | 8.9 | $ | 9.0 | ||
The restriction on approximately $4.6 billion of cash and cash equivalents was released in 2007 following an Alabama Supreme Court judgment in ExxonMobil’s favor (see note 15).
A30
| 2008 | 2007 | |||||
| (billions of dollars) | ||||||
Petroleum products | $ | 3.7 | $ | 3.8 | ||
Crude oil | 3.1 | 2.6 | ||||
Chemical products | 2.2 | 2.1 | ||||
Gas/other | 0.3 | 0.4 | ||||
Total | $ | 9.3 | $ | 8.9 | ||
4.Cash4. Cash Flow Information
The Consolidated Statement of Cash Flows provides information about changes in cash and cash equivalents. Highly liquid investments with maturities of three months or less when acquired are classified as cash equivalents.
The “Net (gain) on asset sales” in net cash provided by operating activities on the Consolidated Statement of Cash Flows includes the before-tax gaingains from the Corporation’s sale of its investmenta natural gas transportation business in SinopecGermany and other producing properties in 2005. Other gains are primarilythe Upstream and Downstream assets and investments in 2008; from the sale of producing properties in the Upstream and of Downstream assets and investments in 20072007; and from the sale of Upstream producing properties in 2006 and 2005.2006. These gains are reported in “Other income” on the Consolidated Statement of Income.
The restriction on $4.6 billion of cash and cash equivalents was released in 2007 following an Alabama Supreme Court judgment in ExxonMobil’s favor.
| 2007 | 2006 | 2005 | |||||||
| (millions of dollars) | |||||||||
Cash payments for interest | $ | 555 | $ | 1,382 | $ | 473 | |||
Cash payments for income taxes | $ | 26,342 | $ | 26,165 | $ | 22,535 | |||
| 2008 | 2007 | 2006 | |||||||
| (millions of dollars) | |||||||||
Cash payments for interest | $ | 650 | $ | 555 | $ | 1,382 | |||
Cash payments for income taxes | $ | 33,941 | $ | 26,342 | $ | 26,165 | |||
5.Additional5. Additional Working Capital Information
| Dec. 31 2007 | Dec. 31 2006 | Dec. 31 2008 | Dec. 31 2007 | |||||||||
| (millions of dollars) | (millions of dollars) | |||||||||||
Notes and accounts receivable | ||||||||||||
Trade, less reserves of $258 million and $306 million | $ | 30,775 | $ | 25,076 | ||||||||
Other, less reserves of $36 million and $64 million | 5,675 | 3,866 | ||||||||||
Trade, less reserves of $219 million and $258 million | $ | 18,707 | $ | 30,775 | ||||||||
Other, less reserves of $43 million and $36 million | 5,995 | 5,675 | ||||||||||
Total | $ | 36,450 | $ | 28,942 | $ | 24,702 | $ | 36,450 | ||||
Notes and loans payable | ||||||||||||
Bank loans | $ | 1,238 | $ | 753 | $ | 1,139 | $ | 1,238 | ||||
Commercial paper | 205 | 274 | 172 | 205 | ||||||||
Long-term debt due within one year | 318 | 459 | 368 | 318 | ||||||||
Other | 622 | 216 | 721 | 622 | ||||||||
Total | $ | 2,383 | $ | 1,702 | $ | 2,400 | $ | 2,383 | ||||
Accounts payable and accrued liabilities | ||||||||||||
Trade payables | $ | 29,239 | $ | 25,084 | $ | 21,190 | $ | 29,239 | ||||
Payables to equity companies | 3,556 | 2,597 | 3,552 | 3,556 | ||||||||
Accrued taxes other than income taxes | 6,485 | 6,052 | 5,866 | 6,485 | ||||||||
Other | 5,995 | 5,349 | 6,035 | 5,995 | ||||||||
Total | $ | 45,275 | $ | 39,082 | $ | 36,643 | $ | 45,275 | ||||
On December 31, 2007,2008, unused credit lines for short-term financing totaled approximately $5.7$5.3 billion. Of this total, $3.6$2.7 billion support commercial paper programs under terms negotiated when drawn. The weighted-average interest rate on short-term borrowings outstanding at December 31, 2008, and 2007, was 5.7 percent and 2006, was 5.5 percent.percent, respectively.
A31A30
NOTES TO CONSOLIDATED FINANCIAL STATEMENTS
6.Equity6. Equity Company Information
The summarized financial information below includes amounts related to certain less-than-majority-owned companies and majority-owned subsidiaries where minority shareholders possess the right to participate in significant management decisions (see note 1). These companies are primarily engaged in crude production, natural gas marketing and refining operations in North America; natural gas production, natural gas distribution and downstream operations in Europe; crude production in Kazakhstan; and liquefied natural gas (LNG) operations in Qatar. Also included are several power generation, refining, petrochemical/lubes manufacturing and chemical ventures. The Corporation’s ownership in these ventures is in the form of shares in corporate joint ventures as well as interests in partnerships. The share of total equity company revenues from sales to ExxonMobil consolidated companies was 21 percent, 23 percent 24 percent and 2224 percent in the years 2008, 2007 2006 and 2005,2006, respectively.
| 2007 | 2006 | 2005 | ||||||||||||||||||||||||||||||||||
Equity Company Financial Summary | 2008 | 2007 | 2006 | |||||||||||||||||||||||||||||||||
| Total | ExxonMobil Share | Total | ExxonMobil Share | Total | ExxonMobil Share | Total | ExxonMobil Share | Total | ExxonMobil Share | Total | ExxonMobil Share | |||||||||||||||||||||||||
| (millions of dollars) | (millions of dollars) | |||||||||||||||||||||||||||||||||||
Total revenues | $ | 109,149 | $ | 37,724 | $ | 98,542 | $ | 33,505 | $ | 88,003 | $ | 31,395 | $ | 148,477 | $ | 49,999 | $ | 109,149 | $ | 37,724 | $ | 98,542 | $ | 33,505 | ||||||||||||
Income before income taxes | $ | 30,505 | $ | 11,448 | $ | 24,094 | $ | 8,905 | $ | 24,070 | $ | 9,809 | $ | 42,588 | $ | 15,082 | $ | 30,505 | $ | 11,448 | $ | 24,094 | $ | 8,905 | ||||||||||||
Income taxes | 7,557 | 2,547 | 5,582 | 1,920 | 5,574 | 2,226 | 12,020 | 4,001 | 7,557 | 2,547 | 5,582 | 1,920 | ||||||||||||||||||||||||
Net income | $ | 22,948 | $ | 8,901 | $ | 18,512 | $ | 6,985 | $ | 18,496 | $ | 7,583 | $ | 30,568 | $ | 11,081 | $ | 22,948 | $ | 8,901 | $ | 18,512 | $ | 6,985 | ||||||||||||
Current assets | $ | 29,268 | $ | 10,228 | $ | 24,684 | $ | 8,484 | $ | 24,931 | $ | 8,645 | $ | 29,358 | $ | 9,920 | $ | 29,268 | $ | 10,228 | $ | 24,684 | $ | 8,484 | ||||||||||||
Property, plant and equipment, less accumulated depreciation | 70,591 | 22,638 | 59,691 | 19,602 | 50,622 | 17,149 | 81,916 | 25,974 | 70,591 | 22,638 | 59,691 | 19,602 | ||||||||||||||||||||||||
Other long-term assets | 6,667 | 3,092 | 7,209 | 4,206 | 6,900 | 3,919 | 5,526 | 2,365 | 6,667 | 3,092 | 7,209 | 4,206 | ||||||||||||||||||||||||
Total assets | $ | 106,526 | $ | 35,958 | $ | 91,584 | $ | 32,292 | $ | 82,453 | $ | 29,713 | $ | 116,800 | $ | 38,259 | $ | 106,526 | $ | 35,958 | $ | 91,584 | $ | 32,292 | ||||||||||||
Short-term debt | $ | 3,127 | $ | 1,117 | $ | 2,669 | $ | 888 | $ | 3,412 | $ | 1,179 | $ | 3,462 | $ | 1,085 | $ | 3,127 | $ | 1,117 | $ | 2,669 | $ | 888 | ||||||||||||
Other current liabilities | 20,861 | 7,124 | 16,543 | 5,852 | 15,330 | 5,414 | 22,759 | 7,622 | 20,861 | 7,124 | 16,543 | 5,852 | ||||||||||||||||||||||||
Long-term debt | 19,821 | 2,269 | 16,442 | 1,920 | 13,419 | 2,271 | 26,075 | 3,713 | 19,821 | 2,269 | 16,442 | 1,920 | ||||||||||||||||||||||||
Other long-term liabilities | 8,142 | 3,395 | 7,946 | 3,250 | 7,477 | 3,153 | 9,183 | 3,809 | 8,142 | 3,395 | 7,946 | 3,250 | ||||||||||||||||||||||||
Advances from shareholders | 18,422 | 8,353 | 15,791 | 6,803 | 14,390 | 5,580 | 15,637 | 7,572 | 18,422 | 8,353 | 15,791 | 6,803 | ||||||||||||||||||||||||
Net assets | $ | 36,153 | $ | 13,700 | $ | 32,193 | $ | 13,579 | $ | 28,425 | $ | 12,116 | $ | 39,684 | $ | 14,458 | $ | 36,153 | $ | 13,700 | $ | 32,193 | $ | 13,579 | ||||||||||||
A list of significant equity companies as of December 31, 2007,2008, together with the Corporation’s percentage ownership interest, is detailed below:
| Percentage Ownership Interest | ||
Upstream | ||
Aera Energy LLC | 48 | |
BEB Erdgas und Erdoel GmbH | 50 | |
Cameroon Oil Transportation Company S.A. | 41 | |
Castle Peak Power Company Limited | 60 | |
Golden Pass LNG Terminal LLC | 18 | |
Nederlandse Aardolie Maatschappij B.V. | 50 | |
Qatar Liquefied Gas Company Limited | 10 | |
Qatar Liquefied Gas Company Limited II | 24 | |
Ras Laffan Liquefied Natural Gas Company Limited | 25 | |
Ras Laffan Liquefied Natural Gas Company Limited II | 30 | |
Ras Laffan Liquefied Natural Gas Company Limited (3) | 30 | |
South Hook LNG Terminal Company Limited | 24 | |
Tengizchevroil, LLP | 25 | |
Terminale GNL Adriatico | 45 | |
Downstream | ||
Chalmette Refining, LLC | 50 | |
Fujian Refining & Petrochemical | 25 | |
Saudi Aramco Mobil Refinery Company Ltd. | 50 | |
Chemical | ||
Al-Jubail Petrochemical Company | 50 | |
Infineum Holdings B.V. | 50 | |
Saudi Yanbu Petrochemical Co. | 50 | |
A32A31
NOTES TO CONSOLIDATED FINANCIAL STATEMENTS
7.Investments,7. Investments, Advances and Long-Term Receivables
| Dec. 31 2007 | Dec. 31 2006 | Dec. 31 2008 | Dec. 31 2007 | |||||||||
| (millions of dollars) | (millions of dollars) | |||||||||||
Companies carried at equity in underlying assets | ||||||||||||
Investments | $ | 13,700 | $ | 13,579 | $ | 14,458 | $ | 13,700 | ||||
Advances | 8,353 | 6,803 | 7,572 | 8,353 | ||||||||
| $ | 22,053 | $ | 20,382 | $ | 22,030 | $ | 22,053 | |||||
Companies carried at cost or less and stock investments carried at fair value | 1,647 | 1,678 | 1,636 | 1,647 | ||||||||
| $ | 23,700 | $ | 22,060 | $ | 23,666 | $ | 23,700 | |||||
Long-term receivables and miscellaneous investments at cost or less | 4,494 | 1,177 | ||||||||||
Long-term receivables and miscellaneous investments at cost or less, net of reserves of $1,288 million and $1,197 million | 4,890 | 4,494 | ||||||||||
Total | $ | 28,194 | $ | 23,237 | $ | 28,556 | $ | 28,194 | ||||
8.Property,8. Property, Plant and Equipment and Asset Retirement Obligations
| Dec. 31, 2007 | Dec. 31, 2006 | Dec. 31, 2008 | Dec. 31, 2007 | |||||||||||||||||||||
Property, Plant and Equipment | Cost | Net | Cost | Net | Cost | Net | Cost | Net | ||||||||||||||||
| (millions of dollars) | (millions of dollars) | |||||||||||||||||||||||
Upstream | $ | 178,712 | $ | 73,524 | $ | 163,087 | $ | 68,410 | $ | 168,977 | $ | 73,413 | $ | 178,712 | $ | 73,524 | ||||||||
Downstream | 65,841 | 30,148 | 62,392 | 28,918 | 64,618 | 29,254 | 65,841 | 30,148 | ||||||||||||||||
Chemical | 24,081 | 10,071 | 22,197 | 9,319 | 25,463 | 11,430 | 24,081 | 10,071 | ||||||||||||||||
Other | 11,706 | 7,126 | 11,608 | 7,040 | 11,787 | 7,249 | 11,706 | 7,126 | ||||||||||||||||
Total | $ | 280,340 | $ | 120,869 | $ | 259,284 | $ | 113,687 | $ | 270,845 | $ | 121,346 | $ | 280,340 | $ | 120,869 | ||||||||
In the Upstream segment, depreciation is generally on a unit-of-production basis, so depreciable life will vary by field. In the Downstream segment, investments in refinery and lubes basestock manufacturing facilities are generally depreciated on a straight-line basis over a 25-year life and service station buildings and fixed improvements over a 20-year life. In the Chemical segment, investments in process equipment are generally depreciated on a straight-line basis over a 20-year life.
Accumulated depreciation and depletion totaled $149,499 million at the end of 2008 and $159,471 million at the end of 2007 and $145,597 million at the end of 2006.2007. Interest capitalized in 2008, 2007 and 2006 and 2005 was $510 million, $557 million $530 million and $434$530 million, respectively.
Asset Retirement Obligations
The Corporation incurs retirement obligations for its upstream assets. The fair values of these obligations are recorded as liabilities on a discounted basis, which is typically at the time the assets are installed. The costs associated with these liabilities are capitalized as part of the related assets and depreciated as the reserves are produced. Over time, the liabilities are accreted for the change in their present value. Asset retirement obligations for downstream and chemical facilities generally become firm at the time the facilities are permanently shut down and dismantled. These obligations may include the costs of asset disposal and additional soil remediation. However, these sites have indeterminate lives based on plans for continued operations and as such, the fair value of the conditional legal obligations cannot be measured, since it is impossible to estimate the future settlement dates of such obligations.
The following table summarizes the activity in the liability for asset retirement obligations:
| 2007 | 2006 | 2008 | 2007 | |||||||||||||
| (millions of dollars) | (millions of dollars) | |||||||||||||||
Beginning balance | $ | 4,703 | $ | 3,568 | $ | 5,141 | $ | 4,703 | ||||||||
Accretion expense and other provisions | 322 | 243 | 335 | 322 | ||||||||||||
Reduction due to property sales | (271 | ) | (202 | ) | (369 | ) | (271 | ) | ||||||||
Payments made | (352 | ) | (238 | ) | (258 | ) | (352 | ) | ||||||||
Liabilities incurred | 113 | 263 | 195 | 113 | ||||||||||||
Foreign currency translation | (837 | ) | 278 | |||||||||||||
Revisions | 348 | 832 | 1,145 | 348 | ||||||||||||
Foreign currency translation/other | 278 | 237 | ||||||||||||||
Ending balance | $ | 5,141 | $ | 4,703 | $ | 5,352 | $ | 5,141 | ||||||||
A33A32
NOTES TO CONSOLIDATED FINANCIAL STATEMENTS
9.Accounting9. Accounting for Suspended Exploratory Well Costs
In accounting for suspended exploratory well costs, the Corporation utilizes Financial Accounting Standards Board Staff Position FAS 19-1 (FSP 19-1), “Accounting for Suspended Well Costs.” FSP 19-1 amended Statement of Financial Accounting Standards No. 19 (FAS 19), “Financial Accounting and Reporting by Oil and Gas Producing Companies,” to permit the continued capitalization of exploratory well costs beyond one year after the well is completed if (a) the well found a sufficient quantity of reserves to justify its completion as a producing well and (b) the entity is making sufficient progress assessing the reserves and the economic and operating viability of the project.
The following two tables provide details of the changes in the balance of suspended exploratory well costs as well as an aging summary of those costs.
Change in capitalized suspended exploratory well costs:
| 2007 | 2006 | 2005 | ||||||||||
| (millions of dollars) | ||||||||||||
Balance beginning at January 1 | $ | 1,305 | $ | 1,139 | $ | 1,070 | ||||||
Additions pending the determination of proved reserves | 228 | 257 | 233 | |||||||||
Charged to expense | (108 | ) | (54 | ) | (62 | ) | ||||||
Reclassifications to wells, facilities and equipment based on the determination of proved reserves | (82 | ) | (22 | ) | (82 | ) | ||||||
Other | (52 | ) | (15 | ) | (20 | ) | ||||||
Ending balance | $ | 1,291 | $ | 1,305 | $ | 1,139 | ||||||
Ending balance attributed to equity companies included above | $ | 3 | $ | 17 | $ | 2 | ||||||
Period end capitalized suspended exploratory well costs:
| 2007 | 2006 | 2005 | |||||||
| (millions of dollars) | |||||||||
Capitalized for a period of one year or less | $ | 228 | $ | 257 | $ | 233 | |||
Capitalized for a period of between one and five years | 566 | 566 | 485 | ||||||
Capitalized for a period of between five and ten years | 255 | 213 | 167 | ||||||
Capitalized for a period of greater than ten years | 242 | 269 | 254 | ||||||
Capitalized for a period greater than one year – subtotal | $ | 1,063 | $ | 1,048 | $ | 906 | |||
Total | $ | 1,291 | $ | 1,305 | $ | 1,139 | |||
Exploration activity often involves drilling multiple wells, over a number of years, to fully evaluate a project. The table below provides a numerical breakdown of the number of projects with suspended exploratory well costs which had their first capitalized well drilled in the preceding 12 months and those that have had exploratory well costs capitalized for a period greater than 12 months.
| 2008 | 2007 | 2006 | ||||||||||||||||
| (millions of dollars) | ||||||||||||||||||
Balance beginning at January 1 | $ | 1,291 | $ | 1,305 | $ | 1,139 | ||||||||||||
Additions pending the determination of proved reserves | 448 | 228 | 257 | |||||||||||||||
Charged to expense | — | (108 | ) | (54 | ) | |||||||||||||
Reclassifications to wells, facilities and equipment based on the determination of proved reserves | (101 | ) | (82 | ) | (22 | ) | ||||||||||||
Other | (53 | ) | (52 | ) | (15 | ) | ||||||||||||
Ending balance | $ | 1,585 | $ | 1,291 | $ | 1,305 | ||||||||||||
Ending balance attributed to equity companies included above | $ | 10 | $ | 3 | $ | 17 | ||||||||||||
Period end capitalized suspended exploratory well costs: | ||||||||||||||||||
| 2008 | 2007 | 2006 | ||||||||||||||||
| (millions of dollars) | ||||||||||||||||||
Capitalized for a period of one year or less | $ | 448 | $ | 228 | $ | 257 | ||||||||||||
Capitalized for a period of between one and five years | 636 | 566 | 566 | |||||||||||||||
Capitalized for a period of between five and ten years | 225 | 255 | 213 | |||||||||||||||
Capitalized for a period of greater than ten years | 276 | 242 | 269 | |||||||||||||||
Capitalized for a period greater than one year – subtotal | $ | 1,137 | $ | 1,063 | $ | 1,048 | ||||||||||||
Total | $ | 1,585 | $ | 1,291 | $ | 1,305 | ||||||||||||
Exploration activity often involves drilling multiple wells, over a number of years, to fully evaluate a project. The table below provides a numerical breakdown of the number of projects with suspended exploratory well costs which had their first capitalized well drilled in the preceding 12 months and those that have had exploratory well costs capitalized for a period greater than 12 months.
|
| ||||||||||||||||
| 2007 | 2006 | 2005 | 2008 | 2007 | 2006 | |||||||||||||
Number of projects with first capitalized well drilled in the preceding 12 months | 4 | 13 | 16 | 12 | 4 | 13 | ||||||||||||
Number of projects that have exploratory well costs capitalized for a period of greater than 12 months | 49 | 53 | 56 | 50 | 49 | 53 | ||||||||||||
Total | 53 | 66 | 72 | 62 | 53 | 66 | ||||||||||||
A34A33
NOTES TO CONSOLIDATED FINANCIAL STATEMENTS
Of the 4950 projects that have exploratory well costs capitalized for a period greater than 12 months as of December 31, 2007, 292008, 31 projects have drilling in the preceding 12 months or exploratory activity planned in the next two years, while the remaining 2019 projects are those with completed exploratory activity progressing toward development. The table below provides additional detail for those 2019 projects, which total $291$313 million.
| Country/Project | Dec. 31, 2007 | Years Wells Drilled | Comment | Dec. 31, 2008 | Years Wells Drilled | Comment | ||||||
| (millions of dollars) | (millions of dollars) | |||||||||||
Australia | Australia | |||||||||||
– East Pilchard | $9 | 2001 | Gas field near Kipper/Tuna development, awaiting capacity in existing/planned infrastructure. | $7 | 2001 | Gas field near Kipper/Tuna development, awaiting capacity in existing/planned infrastructure. | ||||||
Canada | ||||||||||||
– Hibernia | 36 | 2006 | Progressing development plan and regulatory approvals for tieback to Hibernia gravity-based structure. | 30 | 2006 | Progressing development plan and regulatory approvals for tieback to Hibernia gravity-based structure. | ||||||
Indonesia | Indonesia | |||||||||||
– Natuna | 118 | 1981 - 1983 | Intent to proceed to the next phase of development communicated to government in 2004; discussions with government on near-term development work plans and contract terms are in progress; further technical evaluation and gas marketing activities continued to progress in 2007. | 118 | 1981 - 1983 | Submitted plan of development and communicated intent to enter next phase of development to the government in 2008; development activity under way while continuing discussions with the government on contract terms. | ||||||
Kazakhstan | Kazakhstan | |||||||||||
– Aktote | 42 | 2003 - 2004 | Development study under way to examine tieback to Kashagan field and/or potential development with Kairan field that is still in the exploration phase. | 40 | 2003 - 2004 | Declarations involving field commerciality filed with Kazakhstan government in 2008; progressing commercialization and field development studies. | ||||||
– Kairan | 53 | 2004 - 2007 | Declarations involving field commerciality filed with Kazakhstan government in 2008; progressing commercialization and field development studies. | |||||||||
Nigeria | ||||||||||||
– Etoro-Isobo | 9 | 2002 | Offshore satellite development which will tie back to a planned production facility. | 9 | 2002 | Offshore satellite development which will tie back to a planned production facility. | ||||||
– Other (4 projects) | 12 | 2001 - 2002 | Actively pursuing development of several additional offshore satellite discoveries which will tie back to existing/planned production facilities. | 12 | 2001 - 2002 | Actively pursuing development of several additional offshore satellite discoveries which will tie back to existing/planned production facilities. | ||||||
Norway | ||||||||||||
– H-North | 13 | 2007 | Discovery near existing facilities in Fram area; evaluating development options. | |||||||||
United Kingdom | ||||||||||||
– Carrack West | 8 | 2001 | Planned tieback to Carrack production facility; awaiting capacity. | 6 | 2001 | Planned tieback to Carrack production facility; awaiting capacity. | ||||||
– Phyllis | 10 | 2004 | Assessing co-development option with nearby 2005 Barbara discovery. | 7 | 2004 | Progressing unitization and joint development with nearby Barbara discovery. | ||||||
United States | ||||||||||||
– Point Thomson | 28 | 1977 - 1980 | The Point Thomson Unit owners are progressing plans to put the unit into production. A project team continues evaluating gas transportation alternatives. The 2006 order of the Alaska Department of Natural Resources terminating the Point Thomson Unit was reversed on appeal by order of the Alaska Superior Court. | |||||||||
Other | Other | |||||||||||
– Various (8 projects) | 19 | 1979 - 2005 | Projects primarily awaiting capacity in existing or planned infrastructure. | |||||||||
Total – 2007 (20 projects) | $291 | |||||||||||
– Various (6 projects) | 18 | 1979 - 2007 | Projects primarily awaiting capacity in existing or planned infrastructure. | |||||||||
Total – 2008 (19 projects) | $313 | |||||||||||
A35A34
NOTES TO CONSOLIDATED FINANCIAL STATEMENTS
At December 31, 2007,2008, the Corporation and its consolidated subsidiaries held noncancelable operating charters and leases covering drilling equipment, tankers, service stations and other properties with minimum undiscounted lease commitments totaling $9,916$11,188 million as indicated in the table. Estimated related rental income from noncancelable subleases is $191$155 million.
| Lease Payments Under Minimum Commitments | Related Sublease Rental Income | Lease Payments Under Minimum Commitments | Related Sublease Rental Income | |||||||||
| (millions of dollars) | (millions of dollars) | |||||||||||
2008 | $ | 1,994 | $ | 37 | ||||||||
2009 | 1,917 | 32 | $ | 2,278 | $ | 25 | ||||||
2010 | 1,546 | 28 | 1,939 | 22 | ||||||||
2011 | 1,130 | 24 | 1,894 | 20 | ||||||||
2012 | 765 | 18 | 1,385 | 16 | ||||||||
2013 and beyond | 2,564 | 52 | ||||||||||
2013 | 908 | 13 | ||||||||||
2014 and beyond | 2,784 | 59 | ||||||||||
Total | $ | 9,916 | $ | 191 | $ | 11,188 | $ | 155 | ||||
Net rental expenses under both cancelable and noncancelable operating leases incurred during 2008, 2007 2006 and 20052006 were as follows:
| 2007 | 2006 | 2005 | 2008 | 2007 | 2006 | |||||||||||||
| (millions of dollars) | (millions of dollars) | |||||||||||||||||
Rental expense | $ | 3,367 | $ | 3,576 | $ | 2,966 | $ | 4,115 | $ | 3,367 | $ | 3,576 | ||||||
Less sublease rental income | 168 | 172 | 176 | 123 | 168 | 172 | ||||||||||||
Net rental expense | $ | 3,199 | $ | 3,404 | $ | 2,790 | $ | 3,992 | $ | 3,199 | $ | 3,404 | ||||||
| 2007 | 2006 | 2005 | 2008 | 2007 | 2006 | |||||||||||||
Net income per common share | ||||||||||||||||||
Net income(millions of dollars) | $ | 40,610 | $ | 39,500 | $ | 36,130 | $ | 45,220 | $ | 40,610 | $ | 39,500 | ||||||
Weighted average number of common shares outstanding(millions of shares) | 5,517 | 5,913 | 6,266 | 5,149 | 5,517 | 5,913 | ||||||||||||
Net income per common share(dollars) | $ | 7.36 | $ | 6.68 | $ | 5.76 | $ | 8.78 | $ | 7.36 | $ | 6.68 | ||||||
Net income per common share – assuming dilution | ||||||||||||||||||
Net income(millions of dollars) | $ | 40,610 | $ | 39,500 | $ | 36,130 | $ | 45,220 | $ | 40,610 | $ | 39,500 | ||||||
Weighted average number of common shares outstanding(millions of shares) | 5,517 | 5,913 | 6,266 | 5,149 | 5,517 | 5,913 | ||||||||||||
Effect of employee stock-based awards | 60 | 57 | 56 | 54 | 60 | 57 | ||||||||||||
Weighted average number of common shares outstanding – assuming dilution | 5,577 | 5,970 | 6,322 | 5,203 | 5,577 | 5,970 | ||||||||||||
Net income per common share(dollars) | $ | 7.28 | $ | 6.62 | $ | 5.71 | $ | 8.69 | $ | 7.28 | $ | 6.62 | ||||||
Dividends paid per common share(dollars) | $ | 1.37 | $ | 1.28 | $ | 1.14 | $ | 1.55 | $ | 1.37 | $ | 1.28 | ||||||
A36A35
NOTES TO CONSOLIDATED FINANCIAL STATEMENTS
12. Financial Instruments and Derivatives
The fair value of financial instruments is determined by reference to various market data and other valuation techniques as appropriate. Long-term debt is theThe only category of financial instruments whosewhere the difference between fair value differs materially from theand recorded book value.value is of significance is long-term debt. The estimated fair value of total long-term debt, including capitalized lease obligations, at December 31, 2008, and 2007, and 2006, was $7.9$7.6 billion and $7.2$7.9 billion, respectively, as compared to recorded book values of $7.2$7.0 billion and $6.6$7.2 billion.
The Corporation’s size, strong capital structure, geographic diversity and the complementary nature of the Upstream, Downstream and Chemical businesses reduce the Corporation’s enterprise-wide risk from changes in interest rates, currency rates and commodity prices. As a result, the Corporation makes limited use of derivatives to mitigate the impact of such changes. The Corporation does not engage in speculative derivative activities or derivative trading activities nor does it use derivatives with leveraged features. The Corporation maintains a system of controls that includes the authorization, reporting and monitoring of derivative activity. The Corporation’s limited derivative activities pose no material credit or market risks to ExxonMobil’s operations, financial condition or liquidity.
The estimated fair value of derivatives outstanding and recorded on the balance sheet was a net receivable of $118 million and $31 million at year-end 2008 and 2007, and a net payable of $64 million at year-end 2006.respectively. This is the amount that the Corporation would have received from or paid to, third parties if these derivatives had been settled in the open market. The Corporation recognized a before-tax gain of $89 million, $66 million and $397 million and a loss of $312 million related to derivatives during 2008, 2007 2006 and 2005,2006, respectively.
The fair value of derivatives outstanding at year-end 20072008 and gain recognized during the year are immaterial in relation to the Corporation’s year-end cash balance of $34.0$31.4 billion, total assets of $242.1$228.1 billion or net income for the year of $40.6$45.2 billion.
At December 31, 2007,2008, long-term debt consisted of $6,689$6,662 million due in U.S. dollars and $494$363 million representing the U.S. dollar equivalent at year-end exchange rates of amounts payable in foreign currencies. These amounts exclude that portion of long-term debt, totaling $318$368 million, which matures within one year and is included in current liabilities. The amounts of long-term debt maturing, together with sinking fund payments required, in each of the four years after December 31, 2008,2009, in millions of dollars, are: 2009 – $255, 2010 – $203,$306, 2011 – $206 and$301, 2012 – $2,246.$2,433 and 2013 – $135. At December 31, 2007,2008, the Corporation’s unused long-term credit lines were not material.
Summarized long-term borrowingsdebt at year-end 2008 and 2007 and 2006 were asare shown in the table below:
| 2007 | 2006 | |||||
| (millions of dollars) | ||||||
Exxon Capital Corporation | ||||||
6.125% Guaranteed notes due 2008 | $ | — | $ | 160 | ||
SeaRiver Maritime Financial Holdings, Inc.(1) | ||||||
Guaranteed debt securities due 2008-2011(2) | 39 | 52 | ||||
Guaranteed deferred interest debentures due 2012 | ||||||
– Face value net of unamortized discount plus accrued interest | 1,727 | 1,550 | ||||
Mobil Services (Bahamas) Ltd. | ||||||
Variable notes due 2035(3) | 972 | 972 | ||||
Variable notes due 2034(4) | 311 | 311 | ||||
Mobil Producing Nigeria Unlimited(5) | ||||||
Variable notes due 2012-2016 | 708 | 489 | ||||
Esso (Thailand) Public Company Ltd.(6) | ||||||
Variable note due 2009-2012 | 326 | — | ||||
Mobil Corporation | ||||||
8.625% debentures due 2021 | 248 | 248 | ||||
Industrial revenue bonds due 2012-2039(7) | 1,694 | 1,697 | ||||
Other U.S. dollar obligations(8) | 629 | 786 | ||||
Other foreign currency obligations | 120 | 160 | ||||
Capitalized lease obligations(9) | 409 | 220 | ||||
Total long-term debt | $ | 7,183 | $ | 6,645 | ||
| 2008 | 2007 | |||||
| (millions of dollars) | ||||||
SeaRiver Maritime Financial Holdings, Inc.(1) | ||||||
Guaranteed debt securities due 2009-2011(2) | $ | 26 | $ | 39 | ||
Guaranteed deferred interest debentures due 2012 | ||||||
– Face value net of unamortized discount plus accrued interest | 1,925 | 1,727 | ||||
Mobil Services (Bahamas) Ltd. | ||||||
Variable notes due 2035(3) | 972 | 972 | ||||
Variable notes due 2034(4) | 311 | 311 | ||||
Mobil Producing Nigeria Unlimited(5) | ||||||
Variable notes due 2009-2016 | 597 | 708 | ||||
Esso (Thailand) Public Company Ltd.(6) | ||||||
Variable note due 2009-2012 | 236 | 326 | ||||
Mobil Corporation | ||||||
8.625% debentures due 2021 | 248 | 248 | ||||
Industrial revenue bonds due 2012-2039(7) | 1,690 | 1,694 | ||||
Other U.S. dollar obligations(8) | 546 | 629 | ||||
Other foreign currency obligations | 94 | 120 | ||||
Capitalized lease obligations(9) | 380 | 409 | ||||
Total long-term debt | $ | 7,025 | $ | 7,183 | ||
| (1) | Additional information is provided for this subsidiary on the following pages. |
| (2) | Average effective interest rate of 3.1% in 2008 and 5.3% in |
| (3) | Average effective interest rate of 2.9% in 2008 and 5.3% in |
| (4) | Average effective interest rate of 3.6% in 2008 and 5.4% in |
| (5) | Average effective interest rate of 7.4% in 2008 and 8.8% in |
| (6) | Average effective interest rate of 4.3% in 2008 and 4.5% in 2007. |
| (7) | Average effective interest rate of 2.0% in 2008 and 3.9% in |
| (8) | Average effective interest rate of |
| (9) | Average imputed interest rate of 8.7% in 2008 and 7.3% in |
A37A36
NOTES TO CONSOLIDATED FINANCIAL STATEMENTS
Condensed consolidating financial information related to guaranteed securities issued by subsidiaries
Exxon Mobil Corporation has fully and unconditionally guaranteed the deferred interest debentures due 2012 ($1,7271,925 million long-term debt at December 31, 2007)2008) and the debt securities due 20082009 to 2011 ($3926 million long-term and $13 million short-term) of SeaRiver Maritime Financial Holdings, Inc.
SeaRiver Maritime Financial Holdings, Inc. is a 100-percent-owned subsidiary of Exxon Mobil Corporation.
The following condensed consolidating financial information is provided for Exxon Mobil Corporation, as guarantor, and for SeaRiver Maritime Financial Holdings, Inc., as issuer, as an alternative to providing separate financial statements for the issuer. The accounts of Exxon Mobil Corporation and SeaRiver Maritime Financial Holdings, Inc. are presented utilizing the equity method of accounting for investments in subsidiaries.
| Exxon Mobil Corporation Parent Guarantor | SeaRiver Maritime Financial Holdings, Inc. | All Other Subsidiaries | Consolidating and Eliminating Adjustments | Consolidated | Exxon Mobil Corporation Parent Guarantor | SeaRiver Maritime Financial Holdings, Inc. | All Other Subsidiaries | Consolidating and Eliminating Adjustments | Consolidated | |||||||||||||||||||||||||
| (millions of dollars) | (millions of dollars) | |||||||||||||||||||||||||||||||||
Condensed consolidated statement of income for 12 months ended December 31, 2007 | ||||||||||||||||||||||||||||||||||
| Condensed consolidated statement of income for 12 months ended December 31, 2008 | Condensed consolidated statement of income for 12 months ended December 31, 2008 | |||||||||||||||||||||||||||||||||
Revenues and other income | ||||||||||||||||||||||||||||||||||
Sales and other operating revenue, including sales-based taxes | $ | 16,502 | $ | — | $ | 373,826 | $ | — | $ | 390,328 | $ | 17,481 | $ | — | $ | 442,098 | $ | — | $ | 459,579 | ||||||||||||||
Income from equity affiliates | 40,800 | 4 | 8,859 | (40,762 | ) | 8,901 | 45,664 | 9 | 11,055 | (45,647 | ) | 11,081 | ||||||||||||||||||||||
Other income | 488 | — | 4,835 | — | 5,323 | 302 | — | 6,397 | — | 6,699 | ||||||||||||||||||||||||
Intercompany revenue | 39,490 | 101 | 361,263 | (400,854 | ) | — | 48,414 | 45 | 442,305 | (490,764 | ) | — | ||||||||||||||||||||||
Total revenues and other income | 97,280 | 105 | 748,783 | (441,616 | ) | 404,552 | 111,861 | 54 | 901,855 | (536,411 | ) | 477,359 | ||||||||||||||||||||||
Costs and other deductions | ||||||||||||||||||||||||||||||||||
Crude oil and product purchases | 38,260 | — | 535,973 | (374,735 | ) | 199,498 | 48,346 | — | 669,107 | (467,999 | ) | 249,454 | ||||||||||||||||||||||
Production and manufacturing expenses | 7,147 | — | 30,003 | (5,265 | ) | 31,885 | 8,327 | — | 35,298 | (5,720 | ) | 37,905 | ||||||||||||||||||||||
Selling, general and administrative expenses | 2,581 | — | 13,116 | (807 | ) | 14,890 | 3,349 | — | 13,364 | (840 | ) | 15,873 | ||||||||||||||||||||||
Depreciation and depletion | 1,661 | — | 10,589 | — | 12,250 | 1,552 | — | 10,827 | — | 12,379 | ||||||||||||||||||||||||
Exploration expenses, including dry holes | 276 | — | 1,193 | — | 1,469 | 192 | — | 1,259 | — | 1,451 | ||||||||||||||||||||||||
Interest expense | 5,997 | 201 | 14,601 | (20,399 | ) | 400 | 3,859 | 207 | 13,143 | (16,536 | ) | 673 | ||||||||||||||||||||||
Sales-based taxes | — | — | 31,728 | — | 31,728 | — | — | 34,508 | — | 34,508 | ||||||||||||||||||||||||
Other taxes and duties | 48 | — | �� | 40,905 | — | 40,953 | 67 | — | 41,652 | — | 41,719 | |||||||||||||||||||||||
Income applicable to minority and preferred interests | — | — | 1,005 | — | 1,005 | |||||||||||||||||||||||||||||
Income applicable to minority interests | — | — | 1,647 | — | 1,647 | |||||||||||||||||||||||||||||
Total costs and other deductions | 55,970 | 201 | 679,113 | (401,206 | ) | 334,078 | 65,692 | 207 | 820,805 | (491,095 | ) | 395,609 | ||||||||||||||||||||||
Income before income taxes | 41,310 | (96 | ) | 69,670 | (40,410 | ) | 70,474 | 46,169 | (153 | ) | 81,050 | (45,316 | ) | 81,750 | ||||||||||||||||||||
Income taxes | 700 | (34 | ) | 29,198 | — | 29,864 | 949 | (56 | ) | 35,637 | — | 36,530 | ||||||||||||||||||||||
Net income | $ | 40,610 | $ | (62 | ) | $ | 40,472 | $ | (40,410 | ) | $ | 40,610 | $ | 45,220 | $ | (97 | ) | $ | 45,413 | $ | (45,316 | ) | $ | 45,220 | ||||||||||
A37
NOTES TO CONSOLIDATED FINANCIAL STATEMENTS
| Exxon Mobil Corporation Parent Guarantor | SeaRiver Maritime Financial Holdings, Inc. | All Other Subsidiaries | Consolidating and Eliminating Adjustments | Consolidated | |||||||||||||
| (millions of dollars) | |||||||||||||||||
| Condensed consolidated statement of income for 12 months ended December 31, 2007 | |||||||||||||||||
Revenues and other income | |||||||||||||||||
Sales and other operating revenue, including sales-based taxes | $ | 16,502 | $ | — | $ | 373,826 | $ | — | $ | 390,328 | |||||||
Income from equity affiliates | 40,800 | 4 | 8,859 | (40,762 | ) | 8,901 | |||||||||||
Other income | 488 | — | 4,835 | — | 5,323 | ||||||||||||
Intercompany revenue | 39,490 | 101 | 361,263 | (400,854 | ) | — | |||||||||||
Total revenues and other income | 97,280 | 105 | 748,783 | (441,616 | ) | 404,552 | |||||||||||
Costs and other deductions | |||||||||||||||||
Crude oil and product purchases | 38,260 | — | 535,973 | (374,735 | ) | 199,498 | |||||||||||
Production and manufacturing expenses | 7,147 | — | 30,003 | (5,265 | ) | 31,885 | |||||||||||
Selling, general and administrative expenses | 2,581 | — | 13,116 | (807 | ) | 14,890 | |||||||||||
Depreciation and depletion | 1,661 | — | 10,589 | — | 12,250 | ||||||||||||
Exploration expenses, including dry holes | 276 | — | 1,193 | — | 1,469 | ||||||||||||
Interest expense | 5,997 | 201 | 14,601 | (20,399 | ) | 400 | |||||||||||
Sales-based taxes | — | — | 31,728 | — | 31,728 | ||||||||||||
Other taxes and duties | 48 | — | 40,905 | — | 40,953 | ||||||||||||
Income applicable to minority interests | — | — | 1,005 | — | 1,005 | ||||||||||||
Total costs and other deductions | 55,970 | 201 | 679,113 | (401,206 | ) | 334,078 | |||||||||||
Income before income taxes | 41,310 | (96 | ) | 69,670 | (40,410 | ) | 70,474 | ||||||||||
Income taxes | 700 | (34 | ) | 29,198 | — | 29,864 | |||||||||||
Net income | $ | 40,610 | $ | (62 | ) | $ | 40,472 | $ | (40,410 | ) | $ | 40,610 | |||||
| Condensed consolidated statement of income for 12 months ended December 31, 2006 | |||||||||||||||||
Revenues and other income | |||||||||||||||||
Sales and other operating revenue, including sales-based taxes | $ | 16,317 | $ | — | $ | 349,150 | $ | — | $ | 365,467 | |||||||
Income from equity affiliates | 37,911 | 14 | 6,974 | (37,914 | ) | 6,985 | |||||||||||
Other income | 944 | — | 4,239 | — | 5,183 | ||||||||||||
Intercompany revenue | 39,265 | 95 | 328,452 | (367,812 | ) | — | |||||||||||
Total revenues and other income | 94,437 | 109 | 688,815 | (405,726 | ) | 377,635 | |||||||||||
Costs and other deductions | |||||||||||||||||
Crude oil and product purchases | 37,365 | — | 491,169 | (345,988 | ) | 182,546 | |||||||||||
Production and manufacturing expenses | 7,357 | — | 27,120 | (4,949 | ) | 29,528 | |||||||||||
Selling, general and administrative expenses | 2,634 | — | 12,297 | (658 | ) | 14,273 | |||||||||||
Depreciation and depletion | 1,431 | — | 9,985 | — | 11,416 | ||||||||||||
Exploration expenses, including dry holes | 272 | — | 909 | — | 1,181 | ||||||||||||
Interest expense | 4,829 | 182 | 12,388 | (16,745 | ) | 654 | |||||||||||
Sales-based taxes | — | — | 30,381 | — | 30,381 | ||||||||||||
Other taxes and duties | 36 | — | 39,167 | — | 39,203 | ||||||||||||
Income applicable to minority interests | — | — | 1,051 | — | 1,051 | ||||||||||||
Total costs and other deductions | 53,924 | 182 | 624,467 | (368,340 | ) | 310,233 | |||||||||||
Income before income taxes | 40,513 | (73 | ) | 64,348 | (37,386 | ) | 67,402 | ||||||||||
Income taxes | 1,013 | (30 | ) | 26,919 | — | 27,902 | |||||||||||
Net income | $ | 39,500 | $ | (43 | ) | $ | 37,429 | $ | (37,386 | ) | $ | 39,500 | |||||
A38
| Exxon Mobil Corporation Parent Guarantor | SeaRiver Maritime Financial Holdings, Inc. | All Other Subsidiaries | Consolidating and Eliminating Adjustments | Consolidated | |||||||||||||
| (millions of dollars) | |||||||||||||||||
Condensed consolidated statement of income for 12 months ended December 31, 2006 | |||||||||||||||||
Revenues and other income | |||||||||||||||||
Sales and other operating revenue, including sales-based taxes | $ | 16,317 | $ | — | $ | 349,150 | $ | — | $ | 365,467 | |||||||
Income from equity affiliates | 37,911 | 14 | 6,974 | (37,914 | ) | 6,985 | |||||||||||
Other income | 944 | — | 4,239 | — | 5,183 | ||||||||||||
Intercompany revenue | 39,265 | 95 | 328,452 | (367,812 | ) | — | |||||||||||
Total revenues and other income | 94,437 | 109 | 688,815 | (405,726 | ) | 377,635 | |||||||||||
Costs and other deductions | |||||||||||||||||
Crude oil and product purchases | 37,365 | — | 491,169 | (345,988 | ) | 182,546 | |||||||||||
Production and manufacturing expenses | 7,357 | — | 27,120 | (4,949 | ) | 29,528 | |||||||||||
Selling, general and administrative expenses | 2,634 | — | 12,297 | (658 | ) | 14,273 | |||||||||||
Depreciation and depletion | 1,431 | — | 9,985 | — | 11,416 | ||||||||||||
Exploration expenses, including dry holes | 272 | — | 909 | — | 1,181 | ||||||||||||
Interest expense | 4,829 | 182 | 12,388 | (16,745 | ) | 654 | |||||||||||
Sales-based taxes | — | — | 30,381 | — | 30,381 | ||||||||||||
Other taxes and duties | 36 | — | 39,167 | — | 39,203 | ||||||||||||
Income applicable to minority and preferred interests | — | — | 1,051 | — | 1,051 | ||||||||||||
Total costs and other deductions | 53,924 | 182 | 624,467 | (368,340 | ) | 310,233 | |||||||||||
Income before income taxes | 40,513 | (73 | ) | 64,348 | (37,386 | ) | 67,402 | ||||||||||
Income taxes | 1,013 | (30 | ) | 26,919 | — | 27,902 | |||||||||||
Net income | $ | 39,500 | $ | (43 | ) | $ | 37,429 | $ | (37,386 | ) | $ | 39,500 | |||||
Condensed consolidated statement of income for 12 months ended December 31, 2005 | |||||||||||||||||
Revenues and other income | |||||||||||||||||
Sales and other operating revenue, including sales-based taxes | $ | 15,081 | $ | — | $ | 343,874 | $ | — | $ | 358,955 | |||||||
Income from equity affiliates | 32,996 | 6 | 7,584 | (33,003 | ) | 7,583 | |||||||||||
Other income | 834 | — | 3,308 | — | 4,142 | ||||||||||||
Intercompany revenue | 33,546 | 56 | 274,757 | (308,359 | ) | — | |||||||||||
Total revenues and other income | 82,457 | 62 | 629,523 | (341,362 | ) | 370,680 | |||||||||||
Costs and other deductions | |||||||||||||||||
Crude oil and product purchases | 30,451 | — | 447,251 | (292,483 | ) | 185,219 | |||||||||||
Production and manufacturing expenses | 7,177 | — | 24,859 | (5,217 | ) | 26,819 | |||||||||||
Selling, general and administrative expenses | 2,434 | — | 12,480 | (512 | ) | 14,402 | |||||||||||
Depreciation and depletion | 1,341 | — | 8,912 | — | 10,253 | ||||||||||||
Exploration expenses, including dry holes | 137 | — | 827 | — | 964 | ||||||||||||
Interest expense | 2,723 | 159 | 7,790 | (10,176 | ) | 496 | |||||||||||
Sales-based taxes | — | — | 30,742 | — | 30,742 | ||||||||||||
Other taxes and duties | 21 | — | 41,533 | — | 41,554 | ||||||||||||
Income applicable to minority and preferred interests | — | — | 799 | — | 799 | ||||||||||||
Total costs and other deductions | 44,284 | 159 | 575,193 | (308,388 | ) | 311,248 | |||||||||||
Income before income taxes | 38,173 | (97 | ) | 54,330 | (32,974 | ) | 59,432 | ||||||||||
Income taxes | 2,043 | (36 | ) | 21,295 | — | 23,302 | |||||||||||
Net income | $ | 36,130 | $ | (61 | ) | $ | 33,035 | $ | (32,974 | ) | $ | 36,130 | |||||
Condensed consolidating financial information related to guaranteed securities issued by subsidiaries
| Exxon Mobil Corporation Parent Guarantor | SeaRiver Maritime Financial Holdings, Inc. | All Other Subsidiaries | Consolidating and Eliminating Adjustments | Consolidated | |||||||||||||||
| (millions of dollars) | |||||||||||||||||||
Condensed consolidated balance sheet for year ended December 31, 2008 |
| ||||||||||||||||||
Cash and cash equivalents | $ | 4,011 | $ | — | $ | 27,426 | $ | — | $ | 31,437 | |||||||||
Marketable securities | — | — | 570 | — | 570 | ||||||||||||||
Notes and accounts receivable – net | 2,486 | 3 | 23,224 | (1,011 | ) | 24,702 | |||||||||||||
Inventories | 1,253 | — | 10,393 | — | 11,646 | ||||||||||||||
Other current assets | 348 | — | 3,563 | — | 3,911 | ||||||||||||||
Total current assets | 8,098 | 3 | 65,176 | (1,011 | ) | 72,266 | |||||||||||||
Investments, advances and long-term receivables | 202,257 | 432 | 450,604 | (624,737 | ) | 28,556 | |||||||||||||
Property, plant and equipment – net | 16,939 | — | 104,407 | — | 121,346 | ||||||||||||||
Other long-term assets | 214 | 37 | 5,633 | — | 5,884 | ||||||||||||||
Intercompany receivables | 10,026 | 2,057 | 432,902 | (444,985 | ) | — | |||||||||||||
Total assets | $ | 237,534 | $ | 2,529 | $ | 1,058,722 | $ | (1,070,733 | ) | $ | 228,052 | ||||||||
Notes and loans payable | $ | 7 | $ | 13 | $ | 2,380 | $ | — | $ | 2,400 | |||||||||
Accounts payable and accrued liabilities | 3,352 | — | 33,291 | — | 36,643 | ||||||||||||||
Income taxes payable | — | — | 11,068 | (1,011 | ) | 10,057 | |||||||||||||
Total current liabilities | 3,359 | 13 | 46,739 | (1,011 | ) | 49,100 | |||||||||||||
Long-term debt | 279 | 1,951 | 4,795 | — | 7,025 | ||||||||||||||
Postretirement benefits reserves | 11,653 | — | 9,076 | — | 20,729 | ||||||||||||||
Deferred income tax liabilities | 120 | 178 | 19,428 | — | 19,726 | ||||||||||||||
Other long-term liabilities | 5,175 | — | 13,332 | — | 18,507 | ||||||||||||||
Intercompany payables | 103,983 | 382 | 340,620 | (444,985 | ) | — | |||||||||||||
Total liabilities | 124,569 | 2,524 | 433,990 | (445,996 | ) | 115,087 | |||||||||||||
Earnings reinvested | 265,680 | (564 | ) | 116,805 | (116,241 | ) | 265,680 | ||||||||||||
Other shareholders’ equity | (152,715 | ) | 569 | 507,927 | (508,496 | ) | (152,715 | ) | |||||||||||
Total shareholders’ equity | 112,965 | 5 | 624,732 | (624,737 | ) | 112,965 | |||||||||||||
Total liabilities and shareholders’ equity | $ | 237,534 | $ | 2,529 | $ | 1,058,722 | $ | (1,070,733 | ) | $ | 228,052 | ||||||||
Condensed consolidated balance sheet for year ended December 31, 2007 |
| ||||||||||||||||||
Cash and cash equivalents | $ | 1,393 | $ | — | $ | 32,588 | $ | — | $ | 33,981 | |||||||||
Marketable securities | — | — | 519 | — | 519 | ||||||||||||||
Notes and accounts receivable – net | 3,733 | 2 | 34,338 | (1,623 | ) | 36,450 | |||||||||||||
Inventories | 1,198 | — | 9,891 | — | 11,089 | ||||||||||||||
Other current assets | 373 | — | 3,551 | — | 3,924 | ||||||||||||||
Total current assets | 6,697 | 2 | 80,887 | (1,623 | ) | 85,963 | |||||||||||||
Investments, advances and long-term receivables | 208,062 | 362 | 420,262 | (600,492 | ) | 28,194 | |||||||||||||
Property, plant and equipment – net | 16,291 | — | 104,578 | — | 120,869 | ||||||||||||||
Other long-term assets | 221 | 51 | 6,784 | — | 7,056 | ||||||||||||||
Intercompany receivables | 14,577 | 1,961 | 437,433 | (453,971 | ) | — | |||||||||||||
Total assets | $ | 245,848 | $ | 2,376 | $ | 1,049,944 | $ | (1,056,086 | ) | $ | 242,082 | ||||||||
Notes and loans payable | $ | 3 | $ | 13 | $ | 2,367 | $ | — | $ | 2,383 | |||||||||
Accounts payable and accrued liabilities | 3,038 | 1 | 42,236 | — | 45,275 | ||||||||||||||
Income taxes payable | — | — | 12,277 | (1,623 | ) | 10,654 | |||||||||||||
Total current liabilities | 3,041 | 14 | 56,880 | (1,623 | ) | 58,312 | |||||||||||||
Long-term debt | 276 | 1,766 | 5,141 | — | 7,183 | ||||||||||||||
Postretirement benefits reserves | 6,363 | — | 6,915 | — | 13,278 | ||||||||||||||
Deferred income tax liabilities | 1,829 | 212 | 20,858 | — | 22,899 | ||||||||||||||
Other long-term liabilities | 4,945 | — | 13,703 | — | 18,648 | ||||||||||||||
Intercompany payables | 107,632 | 382 | 345,957 | (453,971 | ) | — | |||||||||||||
Total liabilities | 124,086 | 2,374 | 449,454 | (455,594 | ) | 120,320 | |||||||||||||
Earnings reinvested | 228,518 | (467 | ) | 114,037 | (113,570 | ) | 228,518 | ||||||||||||
Other shareholders’ equity | (106,756 | ) | 469 | 486,453 | (486,922 | ) | (106,756 | ) | |||||||||||
Total shareholders’ equity | 121,762 | 2 | 600,490 | (600,492 | ) | 121,762 | |||||||||||||
Total liabilities and shareholders’ equity | $ | 245,848 | $ | 2,376 | $ | 1,049,944 | $ | (1,056,086 | ) | $ | 242,082 | ||||||||
A39
NOTES TO CONSOLIDATED FINANCIAL STATEMENTS
Condensed consolidating financial information related to guaranteed securities issued by subsidiaries
| Exxon Mobil Corporation Parent Guarantor | SeaRiver Maritime Financial Holdings, Inc. | All Other Subsidiaries | Consolidating and Eliminating Adjustments | Consolidated | |||||||||||||||
| (millions of dollars) | |||||||||||||||||||
Condensed consolidated balance sheet for year ended December 31, 2007 |
| ||||||||||||||||||
Cash and cash equivalents | $ | 1,393 | $ | — | $ | 32,588 | $ | — | $ | 33,981 | |||||||||
Cash and cash equivalents – restricted | — | — | — | — | — | ||||||||||||||
Marketable securities | — | — | 519 | — | 519 | ||||||||||||||
Notes and accounts receivable – net | 3,733 | 2 | 34,338 | (1,623 | ) | 36,450 | |||||||||||||
Inventories | 1,198 | — | 9,891 | — | 11,089 | ||||||||||||||
Prepaid taxes and expenses | 373 | — | 3,551 | — | 3,924 | ||||||||||||||
Total current assets | 6,697 | 2 | 80,887 | (1,623 | ) | 85,963 | |||||||||||||
Investments, advances and long-term receivables | 208,062 | 362 | 420,262 | (600,492 | ) | 28,194 | |||||||||||||
Property, plant and equipment – net | 16,291 | — | 104,578 | — | 120,869 | ||||||||||||||
Other long-term assets | 221 | 51 | 6,784 | — | 7,056 | ||||||||||||||
Intercompany receivables | 14,577 | 1,961 | 437,433 | (453,971 | ) | — | |||||||||||||
Total assets | $ | 245,848 | $ | 2,376 | $ | 1,049,944 | $ | (1,056,086 | ) | $ | 242,082 | ||||||||
Notes and loans payable | $ | 3 | $ | 13 | $ | 2,367 | $ | — | $ | 2,383 | |||||||||
Accounts payable and accrued liabilities | 3,038 | 1 | 42,236 | — | 45,275 | ||||||||||||||
Income taxes payable | — | — | 12,277 | (1,623 | ) | 10,654 | |||||||||||||
Total current liabilities | 3,041 | 14 | 56,880 | (1,623 | ) | 58,312 | |||||||||||||
Long-term debt | 276 | 1,766 | 5,141 | — | 7,183 | ||||||||||||||
Deferred income tax liabilities | 1,829 | 212 | 20,858 | — | 22,899 | ||||||||||||||
Other long-term liabilities | 11,308 | — | 20,618 | — | 31,926 | ||||||||||||||
Intercompany payables | 107,632 | 382 | 345,957 | (453,971 | ) | — | |||||||||||||
Total liabilities | 124,086 | 2,374 | 449,454 | (455,594 | ) | 120,320 | |||||||||||||
Earnings reinvested | 228,518 | (467 | ) | 114,037 | (113,570 | ) | 228,518 | ||||||||||||
Other shareholders’ equity | (106,756 | ) | 469 | 486,453 | (486,922 | ) | (106,756 | ) | |||||||||||
Total shareholders’ equity | 121,762 | 2 | 600,490 | (600,492 | ) | 121,762 | |||||||||||||
Total liabilities and shareholders’ equity | $ | 245,848 | $ | 2,376 | $ | 1,049,944 | $ | (1,056,086 | ) | $ | 242,082 | ||||||||
Condensed consolidated balance sheet for year ended December 31, 2006 |
| ||||||||||||||||||
Cash and cash equivalents | $ | 6,355 | $ | — | $ | 21,889 | $ | — | $ | 28,244 | |||||||||
Cash and cash equivalents – restricted | — | — | 4,604 | — | 4,604 | ||||||||||||||
Notes and accounts receivable – net | 2,057 | — | 26,885 | — | 28,942 | ||||||||||||||
Inventories | 1,213 | — | 9,501 | — | 10,714 | ||||||||||||||
Prepaid taxes and expenses | 357 | — | 2,916 | — | 3,273 | ||||||||||||||
Total current assets | 9,982 | — | 65,795 | — | 75,777 | ||||||||||||||
Investments, advances and long-term receivables | 200,982 | 359 | 409,935 | (588,039 | ) | 23,237 | |||||||||||||
Property, plant and equipment – net | 16,730 | — | 96,957 | — | 113,687 | ||||||||||||||
Other long-term assets | 275 | 64 | 5,975 | — | 6,314 | ||||||||||||||
Intercompany receivables | 16,501 | 1,883 | 435,221 | (453,605 | ) | — | |||||||||||||
Total assets | $ | 244,470 | $ | 2,306 | $ | 1,013,883 | $ | (1,041,644 | ) | $ | 219,015 | ||||||||
Notes and loans payable | $ | 90 | $ | 13 | $ | 1,599 | $ | — | $ | 1,702 | |||||||||
Accounts payable and accrued liabilities | 3,025 | 1 | 36,056 | — | 39,082 | ||||||||||||||
Income taxes payable | 548 | 1 | 7,484 | — | 8,033 | ||||||||||||||
Total current liabilities | 3,663 | 15 | 45,139 | — | 48,817 | ||||||||||||||
Long-term debt | 274 | 1,602 | 4,769 | — | 6,645 | ||||||||||||||
Deferred income tax liabilities | 1,975 | 237 | 18,639 | — | 20,851 | ||||||||||||||
Other long-term liabilities | 8,044 | — | 20,814 | — | 28,858 | ||||||||||||||
Intercompany payables | 116,670 | 387 | 336,548 | (453,605 | ) | — | |||||||||||||
Total liabilities | 130,626 | 2,241 | 425,909 | (453,605 | ) | 105,171 | |||||||||||||
Earnings reinvested | 195,207 | (404 | ) | 144,607 | (144,203 | ) | 195,207 | ||||||||||||
Other shareholders’ equity | (81,363 | ) | 469 | 443,367 | (443,836 | ) | (81,363 | ) | |||||||||||
Total shareholders’ equity | 113,844 | 65 | 587,974 | (588,039 | ) | 113,844 | |||||||||||||
Total liabilities and shareholders’ equity | $ | 244,470 | $ | 2,306 | $ | 1,013,883 | $ | (1,041,644 | ) | $ | 219,015 | ||||||||
| Exxon Mobil Corporation Parent Guarantor | SeaRiver Maritime Financial Holdings, Inc. | All Other Subsidiaries | Consolidating and Eliminating Adjustments | Consolidated | ||||||||||||||||
| (millions of dollars) | ||||||||||||||||||||
Condensed consolidated statement of cash flows for 12 months ended December 31, 2008 |
| |||||||||||||||||||
Cash provided by/(used in) operating activities | $ | 47,823 | $ | 68 | $ | 54,478 | $ | (42,644 | ) | $ | 59,725 | |||||||||
Cash flows from investing activities | ||||||||||||||||||||
Additions to property, plant and equipment | (2,154 | ) | — | (17,164 | ) | — | (19,318 | ) | ||||||||||||
Sales of long-term assets | 162 | — | 5,823 | — | 5,985 | |||||||||||||||
Decrease/(increase) in restricted cash and cash equivalents | — | — | — | — | — | |||||||||||||||
Net intercompany investing | (502 | ) | (155 | ) | 476 | 181 | — | |||||||||||||
All other investing, net | — | — | (2,166 | ) | — | (2,166 | ) | |||||||||||||
Net cash provided by/(used in) investing activities | (2,494 | ) | (155 | ) | (13,031 | ) | 181 | (15,499 | ) | |||||||||||
Cash flows from financing activities | ||||||||||||||||||||
Additions to short- and long-term debt | — | — | 1,146 | — | 1,146 | |||||||||||||||
Reductions in short- and long-term debt | (4 | ) | (13 | ) | (1,799 | ) | — | (1,816 | ) | |||||||||||
Additions/(reductions) in debt with three months or less maturity | — | — | 143 | — | 143 | |||||||||||||||
Cash dividends | (8,058 | ) | — | (42,644 | ) | 42,644 | (8,058 | ) | ||||||||||||
Common stock acquired | (35,734 | ) | — | — | — | (35,734 | ) | |||||||||||||
Net intercompany financing activity | — | — | 81 | (81 | ) | — | ||||||||||||||
All other financing, net | 1,085 | 100 | (793 | ) | (100 | ) | 292 | |||||||||||||
Net cash provided by/(used in) financing activities | (42,711 | ) | 87 | (43,866 | ) | 42,463 | (44,027 | ) | ||||||||||||
Effects of exchange rate changes on cash | — | — | (2,743 | ) | — | (2,743 | ) | |||||||||||||
Increase/(decrease) in cash and cash equivalents | $ | 2,618 | $ | — | $ | (5,162 | ) | $ | — | $ | (2,544 | ) | ||||||||
Condensed consolidated statement of cash flows for 12 months ended December 31, 2007 |
| |||||||||||||||||||
Cash provided by/(used in) operating activities | $ | 73,813 | $ | 97 | $ | 49,185 | $ | (71,093 | ) | $ | 52,002 | |||||||||
Cash flows from investing activities | ||||||||||||||||||||
Additions to property, plant and equipment | (1,252 | ) | — | (14,135 | ) | — | (15,387 | ) | ||||||||||||
Sales of long-term assets | 251 | — | 3,953 | — | 4,204 | |||||||||||||||
Decrease/(increase) in restricted cash and cash equivalents | — | — | 4,604 | — | 4,604 | |||||||||||||||
Net intercompany investing | (39,679 | ) | (79 | ) | 39,676 | 82 | — | |||||||||||||
All other investing, net | — | — | (3,149 | ) | — | (3,149 | ) | |||||||||||||
Net cash provided by/(used in) investing activities | (40,680 | ) | (79 | ) | 30,949 | 82 | (9,728 | ) | ||||||||||||
Cash flows from financing activities | ||||||||||||||||||||
Additions to short- and long-term debt | — | — | 1,803 | — | 1,803 | |||||||||||||||
Reductions in short- and long-term debt | (3 | ) | (13 | ) | (1,002 | ) | — | (1,018 | ) | |||||||||||
Additions/(reductions) in debt with three months or less maturity | (97 | ) | — | (90 | ) | — | (187 | ) | ||||||||||||
Cash dividends | (7,621 | ) | — | (71,093 | ) | 71,093 | (7,621 | ) | ||||||||||||
Common stock acquired | (31,822 | ) | — | — | — | (31,822 | ) | |||||||||||||
Net intercompany financing activity | — | (5 | ) | 87 | (82 | ) | — | |||||||||||||
All other financing, net | 1,448 | — | (948 | ) | — | 500 | ||||||||||||||
Net cash provided by/(used in) financing activities | (38,095 | ) | (18 | ) | (71,243 | ) | 71,011 | (38,345 | ) | |||||||||||
Effects of exchange rate changes on cash | — | — | 1,808 | — | 1,808 | |||||||||||||||
Increase/(decrease) in cash and cash equivalents | $ | (4,962 | ) | $ | — | $ | 10,699 | $ | — | $ | 5,737 | |||||||||
A40
| Exxon Mobil Corporation Parent Guarantor | SeaRiver Maritime Financial Holdings, Inc. | All Other Subsidiaries | Consolidating and Eliminating Adjustments | Consolidated | ||||||||||||||||
| (millions of dollars) | ||||||||||||||||||||
Condensed consolidated statement of cash flows for 12 months ended December 31, 2007 |
| |||||||||||||||||||
Cash provided by/(used in) operating activities | $ | 73,813 | $ | 97 | $ | 49,185 | $ | (71,093 | ) | $ | 52,002 | |||||||||
Cash flows from investing activities | ||||||||||||||||||||
Additions to property, plant and equipment | (1,252 | ) | — | (14,135 | ) | — | (15,387 | ) | ||||||||||||
Sales of long-term assets | 251 | — | 3,953 | — | 4,204 | |||||||||||||||
Decrease/(increase) in restricted cash and cash equivalents | — | — | 4,604 | — | 4,604 | |||||||||||||||
Net intercompany investing | (39,679 | ) | (79 | ) | 39,676 | 82 | — | |||||||||||||
All other investing, net | — | — | (3,149 | ) | — | (3,149 | ) | |||||||||||||
Net cash provided by/(used in) investing activities | (40,680 | ) | (79 | ) | 30,949 | 82 | (9,728 | ) | ||||||||||||
Cash flows from financing activities | ||||||||||||||||||||
Additions to short- and long-term debt | — | — | 1,803 | — | 1,803 | |||||||||||||||
Reductions in short- and long-term debt | (3 | ) | (13 | ) | (1,002 | ) | — | (1,018 | ) | |||||||||||
Additions/(reductions) in debt with less than | ||||||||||||||||||||
90-day maturity | (97 | ) | — | (90 | ) | — | (187 | ) | ||||||||||||
Cash dividends | (7,621 | ) | — | (71,093 | ) | 71,093 | (7,621 | ) | ||||||||||||
Common stock acquired | (31,822 | ) | — | — | — | (31,822 | ) | |||||||||||||
Net intercompany financing activity | — | (5 | ) | 87 | (82 | ) | — | |||||||||||||
All other financing, net | 1,448 | — | (948 | ) | — | 500 | ||||||||||||||
Net cash provided by/(used in) financing activities | (38,095 | ) | (18 | ) | (71,243 | ) | 71,011 | (38,345 | ) | |||||||||||
Effects of exchange rate changes on cash | — | — | 1,808 | — | 1,808 | |||||||||||||||
Increase/(decrease) in cash and cash equivalents | $ | (4,962 | ) | $ | — | $ | 10,699 | $ | — | $ | 5,737 | |||||||||
Condensed consolidated statement of cash flows for 12 months ended December 31, 2006 |
| |||||||||||||||||||
Cash provided by/(used in) operating activities | $ | 3,678 | $ | 112 | $ | 47,111 | $ | (1,615 | ) | $ | 49,286 | |||||||||
Cash flows from investing activities | ||||||||||||||||||||
Additions to property, plant and equipment | (1,571 | ) | — | (13,891 | ) | — | (15,462 | ) | ||||||||||||
Sales of long-term assets | 421 | — | 2,659 | — | 3,080 | |||||||||||||||
Decrease/(increase) in restricted cash and cash equivalents | 4,604 | — | (4,604 | ) | — | — | ||||||||||||||
Net intercompany investing | 23,067 | (107 | ) | (23,091 | ) | 131 | — | |||||||||||||
All other investing, net | — | — | (1,848 | ) | — | (1,848 | ) | |||||||||||||
Net cash provided by/(used in) investing activities | 26,521 | (107 | ) | (40,775 | ) | 131 | (14,230 | ) | ||||||||||||
Cash flows from financing activities | ||||||||||||||||||||
Additions to short- and long-term debt | — | — | 652 | — | 652 | |||||||||||||||
Reductions in short- and long-term debt | — | (10 | ) | (474 | ) | — | (484 | ) | ||||||||||||
Additions/(reductions) in debt with less than | ||||||||||||||||||||
90-day maturity | (368 | ) | — | 273 | — | (95 | ) | |||||||||||||
Cash dividends | (7,628 | ) | — | (1,615 | ) | 1,615 | (7,628 | ) | ||||||||||||
Common stock acquired | (29,558 | ) | — | — | — | (29,558 | ) | |||||||||||||
Net intercompany financing activity | — | 5 | 126 | (131 | ) | — | ||||||||||||||
All other financing, net | 1,634 | — | (731 | ) | — | 903 | ||||||||||||||
Net cash provided by/(used in) financing activities | (35,920 | ) | (5 | ) | (1,769 | ) | 1,484 | (36,210 | ) | |||||||||||
Effects of exchange rate changes on cash | — | — | 727 | — | 727 | |||||||||||||||
Increase/(decrease) in cash and cash equivalents | $ | (5,721 | ) | $ | — | $ | 5,294 | $ | — | $ | (427 | ) | ||||||||
A41
NOTES TO CONSOLIDATED FINANCIAL STATEMENTS
Condensed consolidating financial information related to guaranteed securities issued by subsidiaries
| Exxon Mobil Corporation Parent Guarantor | SeaRiver Maritime Financial Holdings, Inc. | All Other Subsidiaries | Consolidating and Eliminating Adjustments | Consolidated | Exxon Mobil Corporation Parent Guarantor | SeaRiver Maritime Financial Holdings, Inc. | All Other Subsidiaries | Consolidating and Eliminating Adjustments | Consolidated | |||||||||||||||||||||||||||||||
| (millions of dollars) | (millions of dollars) | |||||||||||||||||||||||||||||||||||||||
Condensed consolidated statement of cash flows for 12 months ended December 31, 2005 |
| |||||||||||||||||||||||||||||||||||||||
Condensed consolidated statement of cash flows for 12 months ended December 31, 2006 | Condensed consolidated statement of cash flows for 12 months ended December 31, 2006 |
| ||||||||||||||||||||||||||||||||||||||
Cash provided by/(used in) operating activities | $ | 11,538 | $ | 129 | $ | 42,099 | $ | (5,628 | ) | $ | 48,138 | $ | 3,678 | $ | 112 | $ | 47,111 | $ | (1,615 | ) | $ | 49,286 | ||||||||||||||||||
Cash flows from investing activities | ||||||||||||||||||||||||||||||||||||||||
Additions to property, plant and equipment | (1,296 | ) | — | (12,543 | ) | — | (13,839 | ) | (1,571 | ) | — | (13,891 | ) | — | (15,462 | ) | ||||||||||||||||||||||||
Sales of long-term assets | 314 | — | 5,722 | — | 6,036 | 421 | — | 2,659 | — | 3,080 | ||||||||||||||||||||||||||||||
Decrease/(increase) in restricted cash and cash equivalents | — | — | — | — | — | 4,604 | — | (4,604 | ) | — | — | |||||||||||||||||||||||||||||
Net intercompany investing | 15,483 | (173 | ) | (15,545 | ) | 235 | — | 23,067 | (107 | ) | (23,091 | ) | 131 | — | ||||||||||||||||||||||||||
All other investing, net | 1 | — | (2,468 | ) | — | (2,467 | ) | — | — | (1,848 | ) | — | (1,848 | ) | ||||||||||||||||||||||||||
Net cash provided by/(used in) investing activities | 14,502 | (173 | ) | (24,834 | ) | 235 | (10,270 | ) | 26,521 | (107 | ) | (40,775 | ) | 131 | (14,230 | ) | ||||||||||||||||||||||||
Cash flows from financing activities | ||||||||||||||||||||||||||||||||||||||||
Additions to short- and long-term debt | — | — | 572 | — | 572 | — | — | 652 | — | 652 | ||||||||||||||||||||||||||||||
Reductions in short- and long-term debt | — | (10 | ) | (758 | ) | — | (768 | ) | — | (10 | ) | (474 | ) | — | (484 | ) | ||||||||||||||||||||||||
Additions/(reductions) in debt with less than 90-day maturity | 446 | — | (1,752 | ) | — | (1,306 | ) | |||||||||||||||||||||||||||||||||
Additions/(reductions) in debt with three months or less maturity | (368 | ) | — | 273 | — | (95 | ) | |||||||||||||||||||||||||||||||||
Cash dividends | (7,185 | ) | — | (5,628 | ) | 5,628 | (7,185 | ) | (7,628 | ) | — | (1,615 | ) | 1,615 | (7,628 | ) | ||||||||||||||||||||||||
Common stock acquired | (18,221 | ) | — | — | — | (18,221 | ) | (29,558 | ) | — | — | — | (29,558 | ) | ||||||||||||||||||||||||||
Net intercompany financing activity | — | (21 | ) | 181 | (160 | ) | — | — | 5 | 126 | (131 | ) | — | |||||||||||||||||||||||||||
All other financing, net | 941 | 75 | (974 | ) | (75 | ) | (33 | ) | 1,634 | — | (731 | ) | — | 903 | ||||||||||||||||||||||||||
Net cash provided by/(used in) financing activities | (24,019 | ) | 44 | (8,359 | ) | 5,393 | (26,941 | ) | (35,920 | ) | (5 | ) | (1,769 | ) | 1,484 | (36,210 | ) | |||||||||||||||||||||||
Effects of exchange rate changes on cash | — | — | (787 | ) | — | (787 | ) | — | — | 727 | — | 727 | ||||||||||||||||||||||||||||
Increase/(decrease) in cash and cash equivalents | $ | 2,021 | $ | — | $ | 8,119 | $ | — | $ | 10,140 | $ | (5,721 | ) | $ | — | $ | 5,294 | $ | — | $ | (427 | ) | ||||||||||||||||||
The 2003 Incentive Program provides for grants of stock options, stock appreciation rights (SARs), restricted stock and other forms of award. Awards may be granted to eligible employees of the Corporation and those affiliates at least 50 percent owned. Outstanding awards are subject to certain forfeiture provisions contained in the program or award instrument. The maximum number of shares of stock that may be issued under the 2003 Incentive Program is 220 million. Awards that are forfeited or expire, or are settled in cash, do not count against this maximum limit. The 2003 Incentive Program does not have a specified term. New awards may be made until the available shares are depleted, unless the Board terminates the plan early. At the end of 2007,2008, remaining shares available for award under the 2003 Incentive Program were 170,695161,718 thousand.
As under earlier programs, options and SARs may be granted at prices not less than 100 percent of market value on the date of grant and have a maximum life of 10 years. Most of the options and SARs normally first become exercisable one year following the date of grant. All remaining stock options and SARs outstanding were granted prior to 2002.
Long-term incentive awards totaling 10,116 thousand, 10,226 thousand and 10,187 thousand and 11,071 thousand shares of restricted (nonvested) common stock and restricted (nonvested) common stock units were granted in 2008, 2007 2006 and 2005,2006, respectively. These shares are issued to employees from treasury stock. The total compensation expense is recognized over the requisite service period. The units that are settled in cash are recorded as liabilities and their changes in fair value are recognized over the vesting period. During the applicable restricted periods, the shares may not be sold or transferred and are subject to forfeiture. The majority of the awards have graded vesting periods, with 50 percent of the shares in each award vesting after three years and the remaining 50 percent vesting after seven years. A small number of awards granted to certain senior executives have vesting periods of five years for 50 percent of the award and of 10 years or retirement, whichever occurs later, for the remaining 50 percent of the award.
A42A41
NOTES TO CONSOLIDATED FINANCIAL STATEMENTS
The Corporation has purchased shares in the open market and through negotiated transactions to offset shares issued in conjunction with benefit plans and programs. Purchases may be discontinued at any time without prior notice.
In 2002, the Corporation began issuing restricted stock as share-based compensation in lieu of stock options. Compensation expense for these awards is based on the price of the stock at the date of grant and has been recognized in income over the requisite service period, which is the same method of accounting as under FAS 123R. Prior to 2002, the Corporation issued stock options as share-based compensation and since these awards vested prior to the effective date of FAS 123R, they continue to be accounted for by the method prescribed in APB 25, “Accounting for Stock Issued to Employees.” Under this method, compensation expense for awards granted in the form of stock options is measured at the intrinsic value of the options (the difference between the market price of the stock and the exercise price of the options) on the date of grant. Since these two prices were the same on the date of grant, no compensation expense has been recognized in income for these awards.
The following table summarizestables summarize information about restricted stock and restricted stock units including those shares from former Mobil plans, for the year ended December 31, 2007.2008.
Restricted Stock and Units Outstanding | Shares | Weighted Average Grant-Date Fair Value per Share | ||||
| (thousands) | ||||||
Issued and outstanding at January 1, 2007 | 36,124 | $ | 47.30 | |||
2006 award issued in 2007 | 10,167 | $ | 73.47 | |||
Vested | (6,795 | ) | $ | 46.02 | ||
Forfeited | (281 | ) | $ | 53.57 | ||
Issued and outstanding at December 31, 2007 | 39,215 | $ | 54.26 | |||
| 2008 | ||||||
Restricted stock and units outstanding | Shares | Weighted Average Grant-Date Fair Value per Share | ||||
| (thousands) | ||||||
Issued and outstanding at January 1 | 39,215 | $ | 54.26 | |||
2007 award issued in 2008 | 10,223 | $ | 87.14 | |||
Vested | (5,479 | ) | $ | 54.44 | ||
Forfeited | (258 | ) | $ | 63.19 | ||
Issued and outstanding at December 31 | 43,701 | $ | 61.88 | |||
Grant Value of Restricted Stock and Units | 2007 | 2006 | 2005 | |||||||||||||||
Grant value of restricted stock and units | 2008 | 2007 | 2006 | |||||||||||||||
Grant price | $ | 87.14 | $ | 73.47 | $ | 58.43 | $ | 78.24 | $ | 87.14 | $ | 73.47 | ||||||
| (millions of dollars) | (millions of dollars) | |||||||||||||||||
Value at date of grant: | ||||||||||||||||||
Restricted stock and units settled in stock | $ | 827 | $ | 704 | $ | 611 | $ | 735 | $ | 827 | $ | 704 | ||||||
Units settled in cash | 64 | 44 | 36 | 56 | 64 | 44 | ||||||||||||
Total value | $ | 891 | $ | 748 | $ | 647 | $ | 791 | $ | 891 | $ | 748 | ||||||
As of December 31, 2007,2008, there was $1,892$2,014 million of unrecognized compensation cost related to the nonvested restricted awards. This cost is expected to be recognized over a weighted-average period of 4.74.6 years. The compensation cost charged against income for the restricted stock and restricted units was $648 million, $590 million and $527 million for 2008, 2007 and $387 million for 2007, 2006, and 2005, respectively. The income tax benefit recognized in income related to this compensation expense was $75 million, $81 million,$72 million and $69$72 million for the same periods, respectively. The fair value of shares and units vested in 2008, 2007 and 2006 and 2005 was $438 million, $581 million $310 million and $288$310 million, respectively. Cash payments of $25 million, $29 million $18 million and $15$18 million for vested restricted stock units settled in cash were made in 2008, 2007 2006 and 2005,2006, respectively.
A43A42
NOTES TO CONSOLIDATED FINANCIAL STATEMENTS
Changes that occurred in stock options in 20072008 are summarized below (shares in thousands):
| 2007 | ||||||||||||||||
Stock Options | Shares | Avg. Exercise Price | Weighted Average Remaining Contractual Term | |||||||||||||
Stock options | 2008 | Weighted Average Remaining Contractual Term | ||||||||||||||
| Shares | Avg. Exercise Price | |||||||||||||||
Outstanding at January 1 | 110,487 | $ | 38.86 | 80,289 | $ | 39.98 | ||||||||||
Exercised | (30,168 | ) | $ | 35.88 | (20,266 | ) | $ | 37.29 | ||||||||
Forfeited | (30 | ) | $ | 37.11 | (30 | ) | $ | 40.75 | ||||||||
Outstanding at December 31 | 80,289 | $ | 39.98 | 2.7 Years | 59,993 | $ | 40.90 | 2.1 Years | ||||||||
Exercisable at December 31 | 80,289 | $ | 39.98 | 2.7 Years | 59,993 | $ | 40.90 | 2.1 Years | ||||||||
No compensation expense was recognized for stock options in 2008, 2007 2006 and 2005,2006, as all remaining outstanding stock options were granted prior to 2002 and are fully vested. Cash received from stock option exercises was $753 million, $1,079 million and $1,173 million for 2008, 2007 and $941 million for 2007, 2006, and 2005, respectively. The cash tax benefit realized for the options exercised was $273 million, $304 million and $416 million for 2008, 2007 and $295 million for 2007, 2006, and 2005, respectively. The aggregate intrinsic value of stock options exercised in 2008, 2007 and 2006 and 2005 was $894 million, $1,359 million $1,304 million and $954$1,304 million, respectively. The intrinsic value for the balance of outstanding stock options at December 31, 2007,2008, was $4,312$2,336 million.
15. Litigation and Other Contingencies
Litigation
A variety of claims have been made against ExxonMobil and certain of its consolidated subsidiaries in a number of pending lawsuits. Management has regular litigation reviews, including updates from corporate and outside counsel, to assess the need for accounting recognition or disclosure of these contingencies. The Corporation accrues an undiscounted liability for those contingencies where the incurrence of a loss is probable and the amount can be reasonably estimated. If a range of amounts can be reasonably estimated and no amount within the range is a better estimate than any other amount, then the minimum of the range is accrued. The Corporation does not record liabilities when the likelihood that the liability has been incurred is probable but the amount cannot be reasonably estimated or when the liability is believed to be only reasonably possible or remote. For contingencies where an unfavorable outcome is reasonably possible and which are significant, the Corporation discloses the nature of the contingency and, where feasible, an estimate of the possible loss. ExxonMobil will continue to defend itself vigorously in these matters. Based on a consideration of all relevant facts and circumstances, the Corporation does not believe the ultimate outcome of any currently pending lawsuit against ExxonMobil will have a materially adverse effect upon the Corporation’s operations or financial condition.
A number of lawsuits, including class actions, were brought in various courts against Exxon Mobil Corporation and certain of its subsidiaries relating to the accidental release of crude oil from the tanker Exxon Valdez in 1989. All the compensatory claims have been resolved and paid. All of the punitive damage claims were consolidated in the civil trial that began in 1994. The first judgment fromOn June 25, 2008, the United States District Court for the District of Alaska in the amount of $5 billion was vacated by the United States Court of Appeals for the Ninth Circuit as being excessive under the Constitution. The second judgment in the amount of $4 billion was vacated by the Ninth Circuit panel without argument and sent back for the District Court to reconsider in light of the recent U.S. Supreme Court decision inCampbell v. State Farm. The most recent District Court judgment forvacated the $2.5 billion punitive damages was for $4.5 billion plus interest and wasdamage award previously entered in January 2004. The Corporation posted a $5.4 billion letter of credit. ExxonMobil and the plaintiffs appealed this decision to the Ninth Circuit, which ruled on December 22, 2006, that the award be reduced to $2.5 billion. On January 12, 2007, ExxonMobil petitionedby the Ninth Circuit Court of Appeals for a rehearing en banc of its appeal. On May 23, 2007, with two dissenting opinions,and remanded the Ninth Circuit determined not to re-hear ExxonMobil’s appeal before the full court. ExxonMobil filed a petition for writ of certioraricase to the U.S. Supreme Court on August 20, 2007. On October 29, 2007, the U.S. Supreme Court granted ExxonMobil’s petition for a writ of certiorari. Oral argument was held on February 27, 2008. While it is reasonably possible that a liability for punitive damages may have been incurred from the Exxon Valdez grounding, it is not possible to predict the ultimate outcome or to reasonably estimate any such potential liability.
In December 2000, a jury in the 15th Judicial Circuit Court of Montgomery County, Alabama, returned a verdict against the Corporation in a dispute over royalties in the amount of $88 million in compensatory damages and $3.4 billion inwith an instruction that punitive damages in the case ofExxon Corporation v. Statemay not exceed a maximum amount of Alabama, et al. The verdict was upheld by the trial court in May 2001. In December 2002, the Alabama Supreme Court vacated the $3.5 billion jury verdict. The case was retried and in November 2003, a state district court jury in Montgomery, Alabama, returned a verdict against$507.5 million. Exxon Mobil Corporation. The verdict included $63.5Corporation recorded an after-tax charge of $290 million in compensatory damages and $11.8 billion inthe second quarter of 2008, reflecting the maximum amount of the punitive damages. In March 2004,The parties have filed briefs in the district court judge reduced the amountNinth Circuit Court of punitive damages to $3.5 billion. ExxonMobil appealed the decision to the Alabama Supreme Court. On November 1, 2007, the Alabama Supreme Court reversed the trial court’s fraud judgment and instructed the district court to enter judgment for ExxonMobilAppeals on the fraud claim, eliminatingissue of post-judgment interest and recovery of costs. Exxon Mobil Corporation recorded an after-tax charge of $170 million in the punitive damage award. The Court also ruled in ExxonMobil’s favor on somethird quarter of 2008, reflecting its estimate of the disputed lease issues, reducing the compensatory award to $52 million plus interest. Following the Alabama Supreme Court’s decision, an appeal bond was canceled and the collateral was subsequently released.resolution of those issues.
A44A43
In 2001, a Louisiana state court jury awarded compensatory damages of $56 million and punitive damages of $1 billion to a landowner for damage caused by a third party that leased the property from the landowner. The third party provided pipe cleaning and storage services for the Corporation and other entities. The Louisiana Fourth Circuit Court of Appeals reduced the punitive damage award to $112 million in 2005. The Corporation appealed this decision to the Louisiana Supreme Court which, in March 2006, refused to hear the appeal. ExxonMobil has fully accrued and paid the compensatory and punitive damage awards. The Corporation appealed the punitive damage award to the U.S. Supreme Court, which on February 26, 2007, vacated the judgment and remanded the case to the Louisiana Fourth Circuit Court of Appeals for reconsideration in light of the recent U.S. Supreme Court decision inWilliams v. Phillip Morris USA. On August 8, 2007, the Fourth Circuit issued its decision on remand and declined to reduce the punitive damage award. On November 16, 2007, the Louisiana Supreme Court denied ExxonMobil’s writ for review of the Fourth Circuit’s decision. ExxonMobil has appealed to the U.S. Supreme Court.NOTES TO CONSOLIDATED FINANCIAL STATEMENTS
Other Contingencies
The Corporation and certain of its consolidated subsidiaries were contingently liable at December 31, 2007,2008, for $5,148$7,847 million, primarily relating to guarantees for notes, loans and performance under contracts. Included in this amount were guarantees by consolidated affiliates of $4,591$6,102 million, representing ExxonMobil’s share of obligations of certain equity companies.
| Dec. 31, 2007 | |||||||||
| Equity Company Obligations | Other Third-Party Obligations | Total | |||||||
| (millions of dollars) | |||||||||
Total guarantees | $ | 4,591 | $ | 557 | $ | 5,148 | |||
| Dec. 31, 2008 | |||||||||
| Equity Company Obligations | Other Third-Party Obligations | Total | |||||||
| (millions of dollars) | |||||||||
Total guarantees | $ | 6,102 | $ | 1,745 | $ | 7,847 | |||
Additionally, the Corporation and its affiliates have numerous long-term sales and purchase commitments in their various business activities, all of which are expected to be fulfilled with no adverse consequences material to the Corporation’s operations or financial condition. Unconditional purchase obligations as defined by accounting standards are those long-term commitments that are noncancelable or cancelable only under certain conditions, and that third parties have used to secure financing for the facilities that will provide the contracted goods or services.
| Payments Due by Period | ||||||||||||
| 2008 | 2009- 2012 | 2013 and Beyond | Total | |||||||||
| (millions of dollars) | ||||||||||||
Unconditional purchase obligations(1) | $ | 490 | $ | 1,497 | $ | 778 | $ | 2,765 | ||||
| Payments Due by Period | ||||||||||||
| 2009 | 2010- 2013 | 2014 and Beyond | Total | |||||||||
| (millions of dollars) | ||||||||||||
Unconditional purchase obligations(1) | $ | 456 | $ | 1,161 | $ | 654 | $ | 2,271 | ||||
| (1) | Undiscounted obligations of |
In accordance with a nationalization decree issued by Venezuela’s president in February 2007, by May 1, 2007, a subsidiary of the Venezuelan National Oil Company (PdVSA) assumed the operatorship of the Cerro Negro Heavy Oil Project. This Project had been operated and owned by ExxonMobil affiliates holding a 41.67 percent ownership interest in the Project. The decree also required conversion of the Cerro Negro Project into a “mixed enterprise” and an increase in PdVSA’s or one of its affiliate’s ownership interest in the Project, with the stipulation that if ExxonMobil refused to accept the terms for the formation of the mixed enterprise within a specified period of time, the government would “directly assume the activities” carried out by the joint venture. ExxonMobil refused to accede to the terms proffered by PdVSA,the government, and on June 27, 2007, the government expropriated ExxonMobil’s 41.67 percent interest in the Cerro Negro Project.
To date, discussions with Venezuelan authorities have not resulted in an agreement on the amount of compensation to be paid to ExxonMobil. On September 6, 2007, affiliates of ExxonMobil filed a Request for Arbitration with the International Centre for Settlement of Investment Disputes. An affiliate of ExxonMobil has also filed an arbitration under the rules of the International Chamber of Commerce against PdVSA and a PdVSA affiliate for breach of their contractual obligations under certain Cerro Negro Project agreements. At this time, the net impact of this matter on the Corporation’s consolidated financial results cannot be reasonably estimated. However, the Corporation does not expect the resolution to have a material effect upon the Corporation’s operations or financial condition. At the time the assets were expropriated, ExxonMobil’s remaining net book investment in Cerro Negro producing assets wasis about $750 million.
A45A44
NOTES TO CONSOLIDATED FINANCIAL STATEMENTS
16. Pension and Other Postretirement Benefits
The benefit obligations and plan assets associated with the Corporation’s principal benefit plans are measured on December 31.
| Pension Benefits | Other Postretirement Benefits | Pension Benefits | Other Postretirement Benefits | |||||||||||||||||||||||||||||||||||||||||||||
| U.S. | Non-U.S. | U.S. | Non-U.S. | |||||||||||||||||||||||||||||||||||||||||||||
| 2007 | 2006 | 2007 | 2006 | 2007 | 2006 | 2008 | 2007 | 2008 | 2007 | 2008 | 2007 | |||||||||||||||||||||||||||||||||||||
| (percent) | (percent) | |||||||||||||||||||||||||||||||||||||||||||||||
Weighted-average assumptions used to determine benefit obligations at December 31 | ||||||||||||||||||||||||||||||||||||||||||||||||
Discount rate | 6.25 | 6.00 | 5.40 | 4.70 | 6.25 | 6.00 | 6.25 | 6. 25 | 5.50 | 5.40 | 6.25 | 6. 25 | ||||||||||||||||||||||||||||||||||||
Long-term rate of compensation increase | 5.00 | 4.50 | 4.50 | 4.20 | 5.00 | 4.50 | 5.00 | 5.00 | 4.70 | 4.50 | 5.00 | 5. 00 | ||||||||||||||||||||||||||||||||||||
| (millions of dollars) | (millions of dollars) | |||||||||||||||||||||||||||||||||||||||||||||||
Change in benefit obligation | ||||||||||||||||||||||||||||||||||||||||||||||||
Benefit obligation at January 1 | $ | 11,305 | $ | 11,181 | $ | 20,956 | $ | 19,310 | $ | 6,843 | $ | 5,370 | $ | 12,062 | $ | 11,305 | $ | 22,475 | $ | 20,956 | $ | 6,828 | $ | 6,843 | ||||||||||||||||||||||||
Service cost | 360 | 335 | 451 | 428 | 109 | 76 | 378 | 360 | 434 | 451 | 100 | 109 | ||||||||||||||||||||||||||||||||||||
Interest cost | 687 | 632 | 1,011 | 911 | 403 | 308 | 729 | 687 | 1,152 | 1,011 | 414 | 403 | ||||||||||||||||||||||||||||||||||||
Actuarial loss/(gain) | 896 | 484 | (665 | ) | (38 | ) | (275 | ) | 1,440 | 1,227 | 896 | 76 | (665 | ) | (243 | ) | (275 | ) | ||||||||||||||||||||||||||||||
Benefits paid(1) (2) | (1,091 | ) | (1,329 | ) | (1,197 | ) | (1,153 | ) | (416 | ) | (419 | ) | (1,124 | ) | (1,091 | ) | (1,286 | ) | (1,197 | ) | (466 | ) | (416 | ) | ||||||||||||||||||||||||
Foreign exchange rate changes | — | — | 1,937 | 1,424 | 73 | — | — | — | (2,682 | ) | 1,937 | (83 | ) | 73 | ||||||||||||||||||||||||||||||||||
Plan amendments, other | (95 | ) | 2 | (18 | ) | 74 | 91 | 68 | — | (95 | ) | (179 | ) | (18 | ) | 83 | 91 | |||||||||||||||||||||||||||||||
Benefit obligation at December 31 | $ | 12,062 | $ | 11,305 | $ | 22,475 | $ | 20,956 | $ | 6,828 | $ | 6,843 | $ | 13,272 | $ | 12,062 | $ | 19,990 | $ | 22,475 | $ | 6,633 | $ | 6,828 | ||||||||||||||||||||||||
Accumulated benefit obligation at December 31 | $ | 10,244 | $ | 9,811 | $ | 20,151 | $ | 18,883 | $ | — | $ | — | $ | 11,000 | $ | 10,244 | $ | 17,893 | $ | 20,151 | $ | — | $ | — | ||||||||||||||||||||||||
| (1) | Benefit payments for funded and unfunded plans. |
| (2) | For |
For U.S. plans, the discount rate is determined by constructing a portfolio of high-quality, noncallable bonds with cash flows that match estimated outflows for benefit payments. For major non-U.S. plans, the discount rate is determined by using bond portfolios with an average maturity approximating that of the liabilities or spot yield curves, both of which are constructed using high-quality, local-currency-denominated bonds.
The measurement of the accumulated postretirement benefit obligation assumes a health care cost trend rate of 7.5 percent for 20082009 that declines to 4.5 percent by 2014. A one-percentage-point increase in the health care cost trend rate would increase service and interest cost by $54$52 million and the postretirement benefit obligation by $564$530 million. A one-percentage-point decrease in the health care cost trend rate would decrease service and interest cost by $44$42 million and the post-retirement benefit obligation by $468$441 million.
The Corporation offers a Medicare supplement plan to Medicare-eligible retirees that provides prescription drug benefits. The Medicare Prescription Drug, Improvement and Modernization Act of 2003 provides a federal subsidy to employers sponsoring retiree health care benefit plans that provide a benefit that is at least actuarially equivalent to Medicare Part D. The Corporation believes that its Medicare supplement plan is at least actuarially equivalent to Medicare Part D.
| Pension Benefits | Other Postretirement Benefits | Pension Benefits | Other Postretirement Benefits | |||||||||||||||||||||||||||||||||||||||||||||
| U.S. | Non-U.S. | U.S. | Non-U.S. | |||||||||||||||||||||||||||||||||||||||||||||
| 2007 | 2006 | 2007 | 2006 | 2007 | 2006 | 2008 | 2007 | 2008 | 2007 | 2008 | 2007 | |||||||||||||||||||||||||||||||||||||
| (millions of dollars) | (millions of dollars) | |||||||||||||||||||||||||||||||||||||||||||||||
Change in plan assets | ||||||||||||||||||||||||||||||||||||||||||||||||
Fair value at January 1 | $ | 9,752 | $ | 7,250 | $ | 14,387 | $ | 12,063 | $ | 501 | $ | 456 | $ | 10,617 | $ | 9,752 | $ | 17,192 | $ | 14,387 | $ | 659 | $ | 501 | ||||||||||||||||||||||||
Actual return on plan assets | 970 | 1,207 | 761 | 1,669 | 23 | 66 | (3,133 | ) | 970 | (3,547 | ) | 761 | (197 | ) | 23 | |||||||||||||||||||||||||||||||||
Foreign exchange rate changes | — | — | 1,284 | 891 | — | — | — | — | (2,321 | ) | 1,284 | — | — | |||||||||||||||||||||||||||||||||||
Company contribution | 800 | 2,383 | 1,666 | 724 | 191 | 34 | 52 | 800 | 956 | 1,666 | 38 | 191 | ||||||||||||||||||||||||||||||||||||
Benefits paid(1) | (905 | ) | (1,088 | ) | (816 | ) | (796 | ) | (56 | ) | (55 | ) | (902 | ) | (905 | ) | (860 | ) | (816 | ) | (57 | ) | (56 | ) | ||||||||||||||||||||||||
Other | — | — | (90 | ) | (164 | ) | — | — | — | — | (160 | ) | (90 | ) | — | — | ||||||||||||||||||||||||||||||||
Fair value at December 31 | $ | 10,617 | $ | 9,752 | $ | 17,192 | $ | 14,387 | $ | 659 | $ | 501 | $ | 6,634 | $ | 10,617 | $ | 11,260 | $ | 17,192 | $ | 443 | $ | 659 | ||||||||||||||||||||||||
| (1) | Benefit payments for funded plans. |
A46A45
NOTES TO CONSOLIDATED FINANCIAL STATEMENTS
The funding levels of all qualified pension plans are in compliance with standards set by applicable law or regulation. As shown in the table below, certain smaller U.S. pension plans and a number of non-U.S. pension plans are not funded because local tax conventions and regulatory practices do not encourage funding of these plans. All defined benefit pension obligations, regardless of the funding status of the underlying plans, are fully supported by the financial strength of the Corporation or the respective sponsoring affiliate.
In 2007 and 2006, the Corporation contributed $800 million and $2,383 million, respectively, to the U.S. funded pension plan, approximately the maximum tax-deductible amount. As a result, year-end 2007 U.S. pension assets of $10,617 million were $1,493 million greater than the funded plan accumulated benefit obligation of $9,124 million.
| Pension Benefits | Pension Benefits | |||||||||||||||||||||||||||||||
| U.S. | Non-U.S. | U.S. | Non-U.S. | |||||||||||||||||||||||||||||
| 2007 | 2006 | 2007 | 2006 | 2008 | 2007 | 2008 | 2007 | |||||||||||||||||||||||||
| (millions of dollars) | (millions of dollars) | |||||||||||||||||||||||||||||||
Assets in excess of/(less than) benefit obligation | ||||||||||||||||||||||||||||||||
Balance at December 31 | ||||||||||||||||||||||||||||||||
Funded plans | $ | (64 | ) | $ | (254 | ) | $ | 192 | $ | (1,479 | ) | $ | (5,049 | ) | $ | (64 | ) | $ | (3,416 | ) | $ | 192 | ||||||||||
Unfunded plans | (1,381 | ) | (1,299 | ) | (5,475 | ) | (5,090 | ) | (1,589 | ) | (1,381 | ) | (5,314 | ) | (5,475 | ) | ||||||||||||||||
Total | $ | (1,445 | ) | $ | (1,553 | ) | $ | (5,283 | ) | $ | (6,569 | ) | $ | (6,638 | ) | $ | (1,445 | ) | $ | (8,730 | ) | $ | (5,283 | ) | ||||||||
Effective December 31, 2006, Exxon Mobil Corporation implemented FASB Statement No. 158, “Employers’ Accounting for Defined Benefit Pension and Other Postretirement Plans,” which requires an employer to recognize the overfunded or underfunded status of a defined benefit postretirement plan as an asset or liability in its statement of financial position and to recognize changes in that funded status in the year in which the changes occur through other comprehensive income.
| Pension Benefits | Other Postretirement Benefits | Pension Benefits | Other Postretirement Benefits | |||||||||||||||||||||||||||||||||||||||||||||
| U.S. | Non-U.S. | U.S. | Non-U.S. | |||||||||||||||||||||||||||||||||||||||||||||
| 2007 | 2006 | 2007 | 2006 | 2007 | 2006 | 2008 | 2007 | 2008 | 2007 | 2008 | 2007 | |||||||||||||||||||||||||||||||||||||
| (millions of dollars) | (millions of dollars) | |||||||||||||||||||||||||||||||||||||||||||||||
Assets in excess of/(less than) benefit obligation | ||||||||||||||||||||||||||||||||||||||||||||||||
Balance at December 31(1) | $ | (1,445 | ) | $ | (1,553 | ) | $ | (5,283 | ) | $ | (6,569 | ) | $ | (6,169 | ) | $ | (6,342 | ) | $ | (6,638 | ) | $ | (1,445 | ) | $ | (8,730 | ) | $ | (5,283 | ) | $ | (6,190 | ) | $ | (6,169 | ) | ||||||||||||
Amounts recorded in the consolidated balance sheet consist of: | ||||||||||||||||||||||||||||||||||||||||||||||||
Other assets | $ | 43 | $ | 36 | $ | 1,168 | $ | 196 | $ | — | $ | — | $ | 1 | $ | 43 | $ | 3 | $ | 1,168 | $ | — | $ | — | ||||||||||||||||||||||||
Current liabilities | (177 | ) | (160 | ) | (329 | ) | (294 | ) | (324 | ) | (311 | ) | (208 | ) | (177 | ) | (304 | ) | (329 | ) | (321 | ) | (324 | ) | ||||||||||||||||||||||||
Postretirement benefits reserves | (1,311 | ) | (1,429 | ) | (6,122 | ) | (6,471 | ) | (5,845 | ) | (6,031 | ) | (6,431 | ) | (1,311 | ) | (8,429 | ) | (6,122 | ) | (5,869 | ) | (5,845 | ) | ||||||||||||||||||||||||
Total recorded | $ | (1,445 | ) | $ | (1,553 | ) | $ | (5,283 | ) | $ | (6,569 | ) | $ | (6,169 | ) | $ | (6,342 | ) | $ | (6,638 | ) | $ | (1,445 | ) | $ | (8,730 | ) | $ | (5,283 | ) | $ | (6,190 | ) | $ | (6,169 | ) | ||||||||||||
Amounts recorded in accumulated other comprehensive income consist of: | ||||||||||||||||||||||||||||||||||||||||||||||||
Net actuarial loss/(gain) | $ | 2,378 | $ | 2,044 | $ | 3,520 | $ | 3,838 | $ | 2,346 | $ | 2,831 | $ | 7,240 | $ | 2,378 | $ | 7,161 | $ | 3,520 | $ | 2,159 | $ | 2,346 | ||||||||||||||||||||||||
Prior service cost | 3 | 121 | 810 | 780 | 326 | 401 | 5 | 3 | 582 | 810 | 250 | 326 | ||||||||||||||||||||||||||||||||||||
Total recorded in accumulated other comprehensive income | $ | 2,381 | $ | 2,165 | $ | 4,330 | $ | 4,618 | $ | 2,672 | $ | 3,232 | $ | 7,245 | $ | 2,381 | $ | 7,743 | $ | 4,330 | $ | 2,409 | $ | 2,672 | ||||||||||||||||||||||||
| (1) | Fair value of assets less benefit obligation shown on the preceding page. |
A47A46
NOTES TO CONSOLIDATED FINANCIAL STATEMENTS
| Pension Benefits | Other Postretirement Benefits | Pension Benefits | Other Postretirement Benefits | |||||||||||||||||||||||||||||||||||||||||||||||||||||||||||||||||||||
| U.S. | Non-U.S. | U.S. | Non-U.S. | |||||||||||||||||||||||||||||||||||||||||||||||||||||||||||||||||||||
| 2007 | 2006 | 2005 | 2007 | 2006 | 2005 | 2007 | 2006 | 2005 | 2008 | 2007 | 2006 | 2008 | 2007 | 2006 | 2008 | 2007 | 2006 | |||||||||||||||||||||||||||||||||||||||||||||||||||||||
| (percent) | (percent) | |||||||||||||||||||||||||||||||||||||||||||||||||||||||||||||||||||||||
Weighted-average assumptions used to determine net periodic benefit cost for years ended December 31 | ||||||||||||||||||||||||||||||||||||||||||||||||||||||||||||||||||||||||
Discount rate | 6.00 | 5.75 | 5.75 | 4.70 | 4.50 | 4.90 | 6.00 | 5.75 | 5.75 | 6.25 | 6.00 | 5.75 | 5.40 | 4.70 | 4.50 | 6.25 | 6.00 | 5.75 | ||||||||||||||||||||||||||||||||||||||||||||||||||||||
Long-term rate of return on funded assets | 9.00 | 9.00 | 9.00 | 7.70 | 7.70 | 7.70 | 9.00 | 9.00 | 9.00 | 9.00 | 9.00 | 9.00 | 7.50 | 7.70 | 7.70 | 9.00 | 9.00 | 9.00 | ||||||||||||||||||||||||||||||||||||||||||||||||||||||
Long-term rate of compensation increase | 4.50 | 4.50 | 4.50 | 4.20 | 3.90 | 3.80 | 4.50 | 4.50 | 4.50 | 5.00 | 4.50 | 4.50 | 4.50 | 4.20 | 3.90 | 5.00 | 4.50 | 4.50 | ||||||||||||||||||||||||||||||||||||||||||||||||||||||
| (millions of dollars) | (millions of dollars) | |||||||||||||||||||||||||||||||||||||||||||||||||||||||||||||||||||||||
Components of net periodic benefit cost | ||||||||||||||||||||||||||||||||||||||||||||||||||||||||||||||||||||||||
Service cost | $ | 360 | $ | 335 | $ | 330 | $ | 451 | $ | 428 | $ | 382 | $ | 109 | $ | 76 | $ | 70 | $ | 378 | $ | 360 | $ | 335 | $ | 434 | $ | 451 | $ | 428 | $ | 100 | $ | 109 | $ | 76 | ||||||||||||||||||||||||||||||||||||
Interest cost | 687 | 632 | 611 | 1,011 | 911 | 834 | 403 | 308 | 301 | 729 | 687 | 632 | 1,152 | 1,011 | 911 | 414 | 403 | 308 | ||||||||||||||||||||||||||||||||||||||||||||||||||||||
Expected return on plan assets | (844 | ) | (620 | ) | (629 | ) | (1,105 | ) | (982 | ) | (789 | ) | (44 | ) | (41 | ) | (39 | ) | (915 | ) | (844 | ) | (620 | ) | (1,200 | ) | (1,105 | ) | (982 | ) | (59 | ) | (44 | ) | (41 | ) | ||||||||||||||||||||||||||||||||||||
Amortization of actuarial loss/(gain) | 246 | 249 | 247 | 362 | 434 | 360 | 243 | 145 | 131 | 239 | 246 | 249 | 318 | 362 | 434 | 197 | 243 | 145 | ||||||||||||||||||||||||||||||||||||||||||||||||||||||
Amortization of prior service cost | 23 | 24 | 27 | 89 | 79 | 64 | 75 | 73 | 73 | (2 | ) | 23 | 24 | 93 | 89 | 79 | 76 | 75 | 73 | |||||||||||||||||||||||||||||||||||||||||||||||||||||
Net pension enhancement and curtailment/settlement expense | 190 | 157 | 123 | 19 | 47 | 10 | 9 | — | — | 174 | 190 | 157 | 32 | 19 | 47 | — | 9 | — | ||||||||||||||||||||||||||||||||||||||||||||||||||||||
Net periodic benefit cost | $ | 662 | $ | 777 | $ | 709 | $ | 827 | $ | 917 | $ | 861 | $ | 795 | $ | 561 | $ | 536 | $ | 603 | $ | 662 | $ | 777 | $ | 829 | $ | 827 | $ | 917 | $ | 728 | $ | 795 | $ | 561 | ||||||||||||||||||||||||||||||||||||
Changes in amounts recorded in accumulated other comprehensive income: | ||||||||||||||||||||||||||||||||||||||||||||||||||||||||||||||||||||||||
Net actuarial loss/(gain) | $ | 770 | $ | 1,265 | $ | (196 | ) | $ | (294 | ) | $ | 914 | $ | (74 | ) | $ | (245 | ) | $ | 2,831 | $ | — | $ | 5,275 | $ | 770 | $ | 1,265 | $ | 4,837 | $ | (294 | ) | $ | 914 | $ | 13 | $ | (245 | ) | $ | 2,831 | ||||||||||||||||||||||||||||||
Amortization of actuarial (loss)/gain | (436 | ) | — | — | (381 | ) | — | — | (252 | ) | — | — | (413 | ) | (436 | ) | — | (350 | ) | (381 | ) | — | (197 | ) | (252 | ) | — | |||||||||||||||||||||||||||||||||||||||||||||
Prior service cost/(credit) | (95 | ) | 121 | — | 72 | 780 | — | — | 401 | — | — | (95 | ) | 121 | 16 | 72 | 780 | — | — | 401 | ||||||||||||||||||||||||||||||||||||||||||||||||||||
Amortization of prior service (cost) | (23 | ) | — | — | (89 | ) | — | — | (75 | ) | — | — | 2 | (23 | ) | — | (93 | ) | (89 | ) | — | (76 | ) | (75 | ) | — | ||||||||||||||||||||||||||||||||||||||||||||||
Foreign exchange rate changes | — | — | — | 404 | — | — | 12 | — | — | — | — | — | (997 | ) | 404 | — | (3 | ) | 12 | — | ||||||||||||||||||||||||||||||||||||||||||||||||||||
Total recorded in accumulated other comprehensive income | 216 | 1,386 | (196 | ) | (288 | ) | 1,694 | (74 | ) | (560 | ) | 3,232 | — | 4,864 | 216 | 1,386 | 3,413 | (288 | ) | 1,694 | (263 | ) | (560 | ) | 3,232 | |||||||||||||||||||||||||||||||||||||||||||||||
Total recorded in net periodic benefit cost and accumulated other comprehensive income, before tax | $ | 878 | $ | 2,163 | $ | 513 | $ | 539 | $ | 2,611 | $ | 787 | $ | 235 | $ | 3,793 | $ | 536 | $ | 5,467 | $ | 878 | $ | 2,163 | $ | 4,242 | $ | 539 | $ | 2,611 | $ | 465 | $ | 235 | $ | 3,793 | ||||||||||||||||||||||||||||||||||||
Costs for defined contribution plans were $309 million, $287 million and $260 million in 2008, 2007 and $251 million in 2007, 2006, and 2005, respectively.
A summary of the change in accumulated other comprehensive income is shown in the table below:
| Total Pension and Other Postretirement Benefits | Total Pension and Other Postretirement Benefits | |||||||||||||||||||||||
| 2007 | 2006 | 2005 | 2008 | 2007 | 2006 | |||||||||||||||||||
| (millions of dollars) | (millions of dollars) | |||||||||||||||||||||||
(Charge)/credit to accumulated other comprehensive income, before tax | ||||||||||||||||||||||||
U.S. pension | $ | (216 | ) | $ | (1,386 | ) | $ | 196 | $ | (4,864 | ) | $ | (216 | ) | $ | (1,386 | ) | |||||||
Non-U.S. pension | 288 | (1,694 | ) | 74 | (3,413 | ) | 288 | (1,694 | ) | |||||||||||||||
Other postretirement benefits | 560 | (3,232 | ) | — | 263 | 560 | (3,232 | ) | ||||||||||||||||
Total (charge)/credit to accumulated other comprehensive income, before tax | 632 | (6,312 | ) | 270 | (8,014 | ) | 632 | (6,312 | ) | |||||||||||||||
(Charge)/credit to income tax (see note 18) | (207 | ) | 2,105 | (90 | ) | 2,723 | (207 | ) | 2,105 | |||||||||||||||
Charge/(credit) to equity of minority shareholders | 61 | 38 | 61 | 224 | 61 | 38 | ||||||||||||||||||
(Charge)/credit to investment in equity companies | 26 | (68 | ) | — | (27 | ) | 26 | (68 | ) | |||||||||||||||
(Charge)/credit to accumulated other comprehensive income, after tax | $ | 512 | $ | (4,237 | ) | $ | 241 | $ | (5,094 | ) | $ | 512 | $ | (4,237 | ) | |||||||||
A48A47
NOTES TO CONSOLIDATED FINANCIAL STATEMENTS
The long-term expected rate of return on funded assets for each plan is established by developing a forward-looking, long-term return assumption for each asset class, taking into account factors such as the expected real return for the specific asset class and inflation. A single, long-term rate of return is then calculated as the weighted average of the target asset allocation and the long-term return assumption for each asset class. The majority of pension assets are invested in equities, as illustrated in the table below, which shows asset allocation.
| Pension Benefits | Other Postretirement Benefits | Pension Benefits | Other Postretirement Benefits | |||||||||||||||||||||||||||||||||
| U.S. | Non-U.S. | U.S. | Non-U.S. | |||||||||||||||||||||||||||||||||
| 2007 | 2006 | 2007 | 2006 | 2007 | 2006 | 2008 | 2007 | 2008 | 2007 | 2008 | 2007 | |||||||||||||||||||||||||
| (percent) | (percent) | |||||||||||||||||||||||||||||||||||
Funded benefit plan asset allocation | ||||||||||||||||||||||||||||||||||||
Equity securities | 75 | % | 75 | % | 65 | % | 69 | % | 75 | % | 75 | % | 73 | % | 75 | % | 63 | % | 65 | % | 70 | % | 75 | % | ||||||||||||
Debt securities | 25 | 25 | 30 | 27 | 25 | 25 | 27 | 25 | 31 | 30 | 30 | 25 | ||||||||||||||||||||||||
Other | — | — | 5 | 4 | — | — | — | — | 6 | 5 | — | — | ||||||||||||||||||||||||
Total | 100 | % | 100 | % | 100 | % | 100 | % | 100 | % | 100 | % | 100 | % | 100 | % | 100 | % | 100 | % | 100 | % | 100 | % | ||||||||||||
The Corporation’s investment strategy for benefit plan assets reflects a long-term view, a careful assessment of the risks inherent in various asset classes and broad diversification to reduce the risk of the portfolio. The Corporation primarily invests in funds that follow an index-based strategy to achieve its objectives of diversifying risk while minimizing costs. The funds hold ExxonMobil stock only to the extent necessary to replicate the relevant equity index. Studies are periodically conducted to establish the preferred target asset allocation. The target asset allocation for equity securities of 75 percent for the U.S. benefit plans and 64 percent for non-U.S. plans reflects the long-term nature of the liability. The balance of the funds is largely targeted to debt securities.
A summary of pension plans with an accumulated benefit obligation in excess of plan assets is shown in the table below:
| Pension Benefits | Pension Benefits | |||||||||||||||||||||||
| U.S. | Non-U.S. | U.S. | Non-U.S. | |||||||||||||||||||||
| 2007 | 2006 | 2007 | 2006 | 2008 | 2007 | 2008 | 2007 | |||||||||||||||||
| (millions of dollars) | (millions of dollars) | |||||||||||||||||||||||
Forfunded pension plans with accumulated benefit obligations in excess of plan assets: | ||||||||||||||||||||||||
Projected benefit obligation | $ | — | $ | 4 | $ | 2,697 | $ | 8,971 | $ | 11,683 | $ | — | $ | 12,226 | $ | 2,697 | ||||||||
Accumulated benefit obligation | — | 3 | 2,527 | 8,322 | 9,810 | — | 11,221 | 2,527 | ||||||||||||||||
Fair value of plan assets | — | 2 | 1,919 | 7,265 | 6,632 | — | 9,002 | 1,919 | ||||||||||||||||
Forunfunded pension plans: | ||||||||||||||||||||||||
Projected benefit obligation | $ | 1,381 | $ | 1,299 | $ | 5,475 | $ | 5,090 | $ | 1,589 | $ | 1,381 | $ | 5,314 | $ | 5,475 | ||||||||
Accumulated benefit obligation | 1,120 | 1,120 | 4,827 | 4,502 | 1,190 | 1,120 | 4,709 | 4,827 | ||||||||||||||||
| Pension Benefits | Other Postretirement Benefits | Pension Benefits | Other Postretirement Benefits | |||||||||||||||
| U.S. | Non-U.S. | U.S. | Non-U.S. | |||||||||||||||
| (millions of dollars) | (millions of dollars) | |||||||||||||||||
Estimated 2008 amortization from accumulated other comprehensive income: | ||||||||||||||||||
Estimated 2009 amortization from accumulated other comprehensive income: | ||||||||||||||||||
Net actuarial loss/(gain)(1) | $ | 382 | $ | 311 | $ | 203 | $ | 1,086 | $ | 674 | $ 178 | |||||||
Prior service cost(2) | (2 | ) | 97 | 76 | — | 86 | 69 | |||||||||||
| (1) | The Corporation amortizes the net balance of actuarial losses/(gains) as a component of net periodic benefit cost over the average remaining service period of active plan participants. |
| (2) | The Corporation amortizes prior service cost on a straight-line basis as permitted under FAS 87 and FAS 106. |
A49A48
NOTES TO CONSOLIDATED FINANCIAL STATEMENTS
| Pension Benefits | Other Postretirement Benefits | Pension Benefits | Other Postretirement Benefits | |||||||||||||||||||
| U.S. | Non-U.S. | Gross | Medicare Subsidy Receipt | U.S. | Non-U.S. | Gross | Medicare Subsidy Receipt | |||||||||||||||
| (millions of dollars) | (millions of dollars) | |||||||||||||||||||||
Contributions expected in 2008 | $ | — | $ | 529 | $ | — | $ — | |||||||||||||||
Contributions expected in 2009 | $ | 3,000 | $ | 1,600 | $ | — | $ — | |||||||||||||||
Benefit payments expected in: | ||||||||||||||||||||||
2008 | 962 | 1,244 | 415 | 23 | ||||||||||||||||||
2009 | 1,014 | 1,227 | 437 | 24 | 1,159 | 1,096 | 415 | 24 | ||||||||||||||
2010 | 1,058 | 1,274 | 460 | 26 | 1,216 | 1,109 | 437 | 25 | ||||||||||||||
2011 | 1,089 | 1,286 | 482 | 27 | 1,260 | 1,123 | 458 | 27 | ||||||||||||||
2012 | 1,140 | 1,338 | 499 | 29 | 1,321 | 1,171 | 474 | 28 | ||||||||||||||
2013 - 2017 | 5,741 | 7,615 | 2,709 | 169 | ||||||||||||||||||
2013 | 1,371 | 1,006 | 491 | 30 | ||||||||||||||||||
2014 - 2018 | 6,219 | 7,339 | 2,645 | 171 | ||||||||||||||||||
17. Disclosures about Segments and Related Information
The Upstream, Downstream and Chemical functions best define the operating segments of the business that are reported separately. The factors used to identify these reportable segments are based on the nature of the operations that are undertaken by each segment. The Upstream segment is organized and operates to explore for and produce crude oil and natural gas. The Downstream segment is organized and operates to manufacture and sell petroleum products. The Chemical segment is organized and operates to manufacture and sell petrochemicals. These segments are broadly understood across the petroleum and petrochemical industries.
These functions have been defined as the operating segments of the Corporation because they are the segments (1) that engage in business activities from which revenues are earned and expenses are incurred; (2) whose operating results are regularly reviewed by the Corporation’s chief operating decision maker to make decisions about resources to be allocated to the segment and assess its performance; and (3) for which discrete financial information is available.
Earnings after income tax include special items, and transfers are at estimated market prices. Special items included in 2008 after-tax earnings were a $1,620 million gain in Non-U.S. Upstream on the sale of a natural gas transportation business in Germany and special charges of $460 million in the corporate and financing segment related to the Valdez litigation. There were no special items in 2007. After-tax earnings in 2006 included a $410 million special gain in the corporate and financing segment from the recognition of tax benefits related to historical investments in non-U.S. assets. Special items included in 2005 after-tax earnings are a $1,620 million gain in Non-U.S. Upstream for the restructuring of a Dutch gas equity company, a $390 million gain in Non-U.S. Chemical relating to joint venture litigation, gains of $310 million and $150 million in Non-U.S. Downstream and Non-U.S. Chemical, respectively, for the Sinopec share sale and a charge of $200 million in U.S. Downstream relating to the Allapattah lawsuit provision.
Interest expense includes non-debt-related interest expense of $498 million, $290 million and $535 million in 2008, 2007 and $3692006, respectively. The increase of $208 million in 2007, 2006 and 2005, respectively.2008 primarily reflects an interest provision related to the Valdez litigation. The decrease of $245 million in 2007 and the increase of $166 million in 2006 primarily reflectreflects changes in tax-related interest.
In corporate and financing activities, interest revenue relates to interest earned on cash deposits and marketable securities.
A50
| Upstream | Downstream | Chemical | Corporate and Financing | Corporate Total | |||||||||||||||||||||
| U.S. | Non-U.S. | U.S. | Non-U.S. | U.S. | Non-U.S. | ||||||||||||||||||||
| (millions of dollars) | |||||||||||||||||||||||||
As of December 31, 2007 | |||||||||||||||||||||||||
Earnings after income tax | $ | 4,870 | $ | 21,627 | $ | 4,120 | $ | 5,453 | $ | 1,181 | $ | 3,382 | $ | (23 | ) | $ | 40,610 | ||||||||
Earnings of equity companies included above | 1,455 | 5,393 | 208 | 641 | 120 | 1,558 | (474 | ) | 8,901 | ||||||||||||||||
Sales and other operating revenue(1) | 5,661 | 22,995 | 101,671 | 223,145 | 13,790 | 23,036 | 30 | 390,328 | |||||||||||||||||
Intersegment revenue | 7,596 | 47,498 | 13,942 | 52,403 | 8,710 | 7,881 | 303 | — | |||||||||||||||||
Depreciation and depletion expense | 1,469 | 7,126 | 639 | 1,662 | 405 | 418 | 531 | 12,250 | |||||||||||||||||
Interest revenue | — | — | — | — | — | — | 1,672 | 1,672 | |||||||||||||||||
Interest expense | 57 | 75 | 14 | 26 | 2 | 2 | 224 | 400 | |||||||||||||||||
Income taxes | 2,686 | 23,328 | 2,141 | 1,405 | 392 | 591 | (679 | ) | 29,864 | ||||||||||||||||
Additions to property, plant and equipment | 1,595 | 9,139 | 1,061 | 1,578 | 335 | 1,078 | 601 | 15,387 | |||||||||||||||||
Investments in equity companies | 2,016 | 7,194 | 488 | 1,172 | 224 | 2,650 | (44 | ) | 13,700 | ||||||||||||||||
Total assets | 21,782 | 84,440 | 18,569 | 54,883 | 7,617 | 13,801 | 40,990 | 242,082 | |||||||||||||||||
As of December 31, 2006 | |||||||||||||||||||||||||
Earnings after income tax | $ | 5,168 | $ | 21,062 | $ | 4,250 | $ | 4,204 | $ | 1,360 | $ | 3,022 | $ | 434 | $ | 39,500 | |||||||||
Earnings of equity companies included above | 1,323 | 4,236 | 227 | 279 | 84 | 1,180 | (344 | ) | 6,985 | ||||||||||||||||
Sales and other operating revenue(1) | 6,054 | 26,821 | 93,437 | 205,020 | 13,273 | 20,825 | 37 | 365,467 | |||||||||||||||||
Intersegment revenue | 7,118 | 39,963 | 12,603 | 46,675 | 7,849 | 6,997 | 292 | — | |||||||||||||||||
Depreciation and depletion expense | 1,263 | 6,482 | 632 | 1,605 | 427 | 473 | 534 | 11,416 | |||||||||||||||||
Interest revenue | — | — | — | — | — | — | 1,571 | 1,571 | |||||||||||||||||
Interest expense | 103 | 264 | 1 | 34 | — | — | 252 | 654 | |||||||||||||||||
Income taxes | 3,130 | 20,932 | 2,318 | 1,174 | 654 | 700 | (1,006 | ) | 27,902 | ||||||||||||||||
Additions to property, plant and equipment | 1,942 | 9,735 | 718 | 1,757 | 257 | 384 | 669 | 15,462 | |||||||||||||||||
Investments in equity companies | 1,665 | 8,065 | 451 | 949 | 245 | 2,261 | (57 | ) | 13,579 | ||||||||||||||||
Total assets | 21,119 | 75,090 | 16,740 | 47,694 | 7,652 | 11,885 | 38,835 | 219,015 | |||||||||||||||||
As of December 31, 2005 | |||||||||||||||||||||||||
Earnings after income tax | $ | 6,200 | $ | 18,149 | $ | 3,911 | $ | 4,081 | $ | 1,186 | $ | 2,757 | $ | (154 | ) | $ | 36,130 | ||||||||
Earnings of equity companies included above | 1,106 | 5,084 | 165 | 471 | 53 | 954 | (250 | ) | 7,583 | ||||||||||||||||
Sales and other operating revenue(1) | 6,730 | 23,324 | 91,954 | 205,726 | 11,842 | 19,344 | 35 | 358,955 | |||||||||||||||||
Intersegment revenue | 7,230 | 31,371 | 9,817 | 40,255 | 6,521 | 5,413 | 290 | — | |||||||||||||||||
Depreciation and depletion expense | 1,293 | 5,407 | 615 | 1,611 | 416 | 410 | 501 | 10,253 | |||||||||||||||||
Interest revenue | — | — | — | — | — | — | 946 | 946 | |||||||||||||||||
Interest expense | 30 | 32 | 230 | 34 | 4 | 4 | 162 | 496 | |||||||||||||||||
Income taxes | 3,516 | 15,968 | 2,139 | 1,362 | 447 | 794 | (924 | ) | 23,302 | ||||||||||||||||
Additions to property, plant and equipment | 1,763 | 8,796 | 662 | 1,618 | 218 | 268 | 514 | 13,839 | |||||||||||||||||
Investments in equity companies | 1,470 | 6,735 | 420 | 937 | 275 | 2,282 | (3 | ) | 12,116 | ||||||||||||||||
Total assets | 20,827 | 66,239 | 16,110 | 47,691 | 7,794 | 11,702 | 37,972 | 208,335 | |||||||||||||||||
Geographic Sales and other operating revenue(1) | 2007 | 2006 | 2005 | ||||||
| (millions of dollars) | |||||||||
United States | $ | 121,144 | $ | 112,787 | $ | 110,553 | |||
Non-U.S. | 269,184 | 252,680 | 248,402 | ||||||
Total | $ | 390,328 | $ | 365,467 | $ | 358,955 | |||
Significant non-U.S. revenue sources include: | |||||||||
Canada | $ | 27,284 | $ | 25,281 | $ | 28,842 | |||
Japan | 26,146 | 27,368 | 28,963 | ||||||
United Kingdom | 25,113 | 24,646 | 24,805 | ||||||
Belgium | 20,550 | 16,271 | 11,281 | ||||||
Germany | 17,445 | 19,458 | 21,653 | ||||||
Italy | 16,255 | 15,332 | 17,160 | ||||||
France | 14,287 | 13,537 | 14,412 | ||||||
Long-lived assets | 2007 | 2006 | 2005 | ||||||
| (millions of dollars) | |||||||||
United States | $ | 33,630 | $ | 33,233 | $ | 33,117 | |||
Non-U.S. | 87,239 | 80,454 | 73,893 | ||||||
Total | $ | 120,869 | $ | 113,687 | $ | 107,010 | |||
Significant non-U.S. long-lived assets include: | |||||||||
Canada | $ | 14,167 | $ | 12,323 | $ | 12,273 | |||
United Kingdom | 8,589 | 9,128 | 7,757 | ||||||
Norway | 7,920 | 6,977 | 6,472 | ||||||
Nigeria | 7,504 | 7,350 | 6,409 | ||||||
Angola | 5,084 | 4,271 | 3,803 | ||||||
Japan | 4,077 | 4,008 | 4,016 | ||||||
Singapore | 3,598 | 2,964 | 2,968 | ||||||
Australia | 3,331 | 2,966 | 2,717 | ||||||
A51A49
NOTES TO CONSOLIDATED FINANCIAL STATEMENTS
| Upstream | Downstream | Chemical | Corporate and Financing | Corporate Total | ||||||||||||||||||||||
| U.S. | Non-U.S. | U.S. | Non-U.S. | U.S. | Non-U.S. | |||||||||||||||||||||
| (millions of dollars) | ||||||||||||||||||||||||||
As of December 31, 2008 | ||||||||||||||||||||||||||
Earnings after income tax | $ | 6,243 | $ | 29,159 | $ | 1,649 | $ | 6,502 | $ | 724 | $ | 2,233 | $ | (1,290 | ) | $ | 45,220 | |||||||||
Earnings of equity companies included above | 1,954 | 7,597 | (2 | ) | 518 | 105 | 1,411 | (502 | ) | 11,081 | ||||||||||||||||
Sales and other operating revenue(1) | 6,767 | 32,346 | 116,701 | 265,359 | 14,136 | 24,252 | 18 | 459,579 | ||||||||||||||||||
Intersegment revenue | 9,617 | 55,069 | 16,225 | 65,723 | 9,925 | 9,749 | 273 | — | ||||||||||||||||||
Depreciation and depletion expense | 1,391 | 7,266 | 656 | 1,672 | 410 | 422 | 562 | 12,379 | ||||||||||||||||||
Interest revenue | — | — | — | — | — | — | 1,400 | 1,400 | ||||||||||||||||||
Interest expense | 47 | 63 | 9 | 28 | 3 | 4 | 519 | 673 | ||||||||||||||||||
Income taxes | 3,451 | 30,654 | 728 | 1,990 | 177 | 10 | (480 | ) | 36,530 | |||||||||||||||||
Additions to property, plant and equipment | 2,699 | 10,545 | 1,550 | 1,552 | 413 | 1,987 | 572 | 19,318 | ||||||||||||||||||
Investments in equity companies | 2,248 | 7,787 | 456 | 1,382 | 241 | 2,384 | (40 | ) | 14,458 | |||||||||||||||||
Total assets | 23,056 | 83,750 | 16,328 | 42,044 | 6,856 | 13,300 | 42,718 | 228,052 | ||||||||||||||||||
As of December 31, 2007 | ||||||||||||||||||||||||||
Earnings after income tax | $ | 4,870 | $ | 21,627 | $ | 4,120 | $ | 5,453 | $ | 1,181 | $ | 3,382 | $ | (23 | ) | $ | 40,610 | |||||||||
Earnings of equity companies included above | 1,455 | 5,393 | 208 | 641 | 120 | 1,558 | (474 | ) | 8,901 | |||||||||||||||||
Sales and other operating revenue(1) | 5,661 | 22,995 | 101,671 | 223,145 | 13,790 | 23,036 | 30 | 390,328 | ||||||||||||||||||
Intersegment revenue | 7,596 | 47,498 | 13,942 | 52,403 | 8,710 | 7,881 | 303 | — | ||||||||||||||||||
Depreciation and depletion expense | 1,469 | 7,126 | 639 | 1,662 | 405 | 418 | 531 | 12,250 | ||||||||||||||||||
Interest revenue | — | — | — | — | — | — | 1,672 | 1,672 | ||||||||||||||||||
Interest expense | 57 | 75 | 14 | 26 | 2 | 2 | 224 | 400 | ||||||||||||||||||
Income taxes | 2,686 | 23,328 | 2,141 | 1,405 | 392 | 591 | (679 | ) | 29,864 | |||||||||||||||||
Additions to property, plant and equipment | 1,595 | 9,139 | 1,061 | 1,578 | 335 | 1,078 | 601 | 15,387 | ||||||||||||||||||
Investments in equity companies | 2,016 | 7,194 | 488 | 1,172 | 224 | 2,650 | (44 | ) | 13,700 | |||||||||||||||||
Total assets | 21,782 | 84,440 | 18,569 | 54,883 | 7,617 | 13,801 | 40,990 | 242,082 | ||||||||||||||||||
As of December 31, 2006 | ||||||||||||||||||||||||||
Earnings after income tax | $ | 5,168 | $ | 21,062 | $ | 4,250 | $ | 4,204 | $ | 1,360 | $ | 3,022 | $ | 434 | $ | 39,500 | ||||||||||
Earnings of equity companies included above | 1,323 | 4,236 | 227 | 279 | 84 | 1,180 | (344 | ) | 6,985 | |||||||||||||||||
Sales and other operating revenue(1) | 6,054 | 26,821 | 93,437 | 205,020 | 13,273 | 20,825 | 37 | 365,467 | ||||||||||||||||||
Intersegment revenue | 7,118 | 39,963 | 12,603 | 46,675 | 7,849 | 6,997 | 292 | — | ||||||||||||||||||
Depreciation and depletion expense | 1,263 | 6,482 | 632 | 1,605 | 427 | 473 | 534 | 11,416 | ||||||||||||||||||
Interest revenue | — | — | — | — | — | — | 1,571 | 1,571 | ||||||||||||||||||
Interest expense | �� | 103 | 264 | 1 | 34 | — | — | 252 | 654 | |||||||||||||||||
Income taxes | 3,130 | 20,932 | 2,318 | 1,174 | 654 | 700 | (1,006 | ) | 27,902 | |||||||||||||||||
Additions to property, plant and equipment | 1,942 | 9,735 | 718 | 1,757 | 257 | 384 | 669 | 15,462 | ||||||||||||||||||
Investments in equity companies | 1,665 | 8,065 | 451 | 949 | 245 | 2,261 | (57 | ) | 13,579 | |||||||||||||||||
Total assets | 21,119 | 75,090 | 16,740 | 47,694 | 7,652 | 11,885 | 38,835 | 219,015 | ||||||||||||||||||
Geographic Sales and other operating revenue(1) | 2008 | 2007 | 2006 | ||||||
| (millions of dollars) | |||||||||
United States | $ | 137,615 | $ | 121,144 | $ | 112,787 | |||
Non-U.S. | 321,964 | 269,184 | 252,680 | ||||||
Total | $ | 459,579 | $ | 390,328 | $ | 365,467 | |||
Significant non-U.S. revenue sources include: | |||||||||
Canada | $ | 33,677 | $ | 27,284 | $ | 25,281 | |||
Japan | 30,126 | 26,146 | 27,368 | ||||||
United Kingdom | 29,764 | 25,113 | 24,646 | ||||||
Belgium | 25,399 | 20,550 | 16,271 | ||||||
Germany | 20,591 | 17,445 | 19,458 | ||||||
France | 18,530 | 14,287 | 13,537 | ||||||
Italy | 17,953 | 16,255 | 15,332 | ||||||
Norway | 12,258 | 10,061 | 8,668 | ||||||
(1) Sales and other operating revenue includes sales-based taxes of $34,508 million for 2008, $31,728 million for 2007 and $30,381 million for 2006. See note 1, Summary of Accounting Policies. | |||||||||
Long-lived assets | 2008 | 2007 | 2006 | ||||||
| (millions of dollars) | |||||||||
United States | $ | 35,548 | $ | 33,630 | $ | 33,233 | |||
Non-U.S. | 85,798 | 87,239 | 80,454 | ||||||
Total | $ | 121,346 | $ | 120,869 | $ | 113,687 | |||
Significant non-U.S. long-lived assets include: | |||||||||
Canada | $ | 12,018 | $ | 14,167 | $ | 12,323 | |||
Nigeria | 9,227 | 7,504 | 7,350 | ||||||
Angola | 6,129 | 5,084 | 4,271 | ||||||
Norway | 5,856 | 7,920 | 6,977 | ||||||
United Kingdom | 5,778 | 8,589 | 9,128 | ||||||
Singapore | 5,113 | 3,598 | 2,964 | ||||||
Japan | 4,769 | 4,077 | 4,008 | ||||||
Qatar | 3,750 | 2,970 | 1,572 | ||||||
A50
18. Income, Sales-Based and Other Taxes
| 2007 | 2006 | 2005 | 2008 | 2007 | 2006 | |||||||||||||||||||||||||||||||||||||||||||||||||||||||
| U.S. | Non-U.S. | Total | U.S. | Non-U.S. | Total | U.S. | Non-U.S. | Total | U.S. | Non-U.S. | Total | U.S. | Non-U.S. | Total | U.S. | Non-U.S. | Total | |||||||||||||||||||||||||||||||||||||||||||
| (millions of dollars) | (millions of dollars) | |||||||||||||||||||||||||||||||||||||||||||||||||||||||||||
Income taxes | ||||||||||||||||||||||||||||||||||||||||||||||||||||||||||||
Federal and non-U.S. | ||||||||||||||||||||||||||||||||||||||||||||||||||||||||||||
Current | $ | 4,666 | $ | 24,329 | $ | 28,995 | $ | 2,851 | $ | 22,666 | $ | 25,517 | $ | 5,462 | $ | 17,052 | $ | 22,514 | $ | 3,005 | $ | 31,377 | $ | 34,382 | $ | 4,666 | $ | 24,329 | $ | 28,995 | $ | 2,851 | $ | 22,666 | $ | 25,517 | ||||||||||||||||||||||||
Deferred – net | (439 | ) | 415 | (24 | ) | 1,194 | 165 | 1,359 | (584 | ) | 362 | (222 | ) | 168 | 1,289 | 1,457 | (439 | ) | 415 | (24 | ) | 1,194 | 165 | 1,359 | ||||||||||||||||||||||||||||||||||||
U.S. tax on non-U.S. operations | 263 | — | 263 | 239 | — | 239 | 208 | — | 208 | 230 | — | 230 | 263 | — | 263 | 239 | — | 239 | ||||||||||||||||||||||||||||||||||||||||||
Total federal and non-U.S. | 4,490 | 24,744 | 29,234 | 4,284 | 22,831 | 27,115 | 5,086 | 17,414 | 22,500 | 3,403 | 32,666 | 36,069 | 4,490 | 24,744 | 29,234 | 4,284 | 22,831 | 27,115 | ||||||||||||||||||||||||||||||||||||||||||
State | 630 | — | 630 | 787 | — | 787 | 802 | — | 802 | 461 | — | 461 | 630 | — | 630 | 787 | — | 787 | ||||||||||||||||||||||||||||||||||||||||||
Total income taxes | 5,120 | 24,744 | 29,864 | 5,071 | 22,831 | 27,902 | 5,888 | 17,414 | 23,302 | 3,864 | 32,666 | 36,530 | 5,120 | 24,744 | 29,864 | 5,071 | 22,831 | 27,902 | ||||||||||||||||||||||||||||||||||||||||||
Sales-based taxes | 7,154 | 24,574 | 31,728 | 7,100 | 23,281 | 30,381 | 7,072 | 23,670 | 30,742 | 6,646 | 27,862 | 34,508 | 7,154 | 24,574 | 31,728 | 7,100 | 23,281 | 30,381 | ||||||||||||||||||||||||||||||||||||||||||
All other taxes and duties | ||||||||||||||||||||||||||||||||||||||||||||||||||||||||||||
Other taxes and duties | 1,008 | 39,945 | 40,953 | 392 | 38,811 | 39,203 | 51 | 41,503 | 41,554 | 1,663 | 40,056 | 41,719 | 1,008 | 39,945 | 40,953 | 392 | 38,811 | 39,203 | ||||||||||||||||||||||||||||||||||||||||||
Included in production and manufacturing expenses | 825 | 1,445 | 2,270 | 976 | 1,431 | 2,407 | 1,182 | 1,075 | 2,257 | 915 | 1,720 | 2,635 | 825 | 1,445 | 2,270 | 976 | 1,431 | 2,407 | ||||||||||||||||||||||||||||||||||||||||||
Included in SG&A expenses | 215 | 653 | 868 | 211 | 572 | 783 | 202 | 558 | 760 | 209 | 660 | 869 | 215 | 653 | 868 | 211 | 572 | 783 | ||||||||||||||||||||||||||||||||||||||||||
Total other taxes and duties | 2,048 | 42,043 | 44,091 | 1,579 | 40,814 | 42,393 | 1,435 | 43,136 | 44,571 | 2,787 | 42,436 | 45,223 | 2,048 | 42,043 | 44,091 | 1,579 | 40,814 | 42,393 | ||||||||||||||||||||||||||||||||||||||||||
Total | $ | 14,322 | $ | 91,361 | $ | 105,683 | $ | 13,750 | $ | 86,926 | $ | 100,676 | $ | 14,395 | $ | 84,220 | $ | 98,615 | $ | 13,297 | $ | 102,964 | $ | 116,261 | $ | 14,322 | $ | 91,361 | $ | 105,683 | $ | 13,750 | $ | 86,926 | $ | 100,676 | ||||||||||||||||||||||||
All other taxes and duties include taxes reported in production and manufacturing and selling, general and administrative (SG&A) expenses. The above provisions for deferred income taxes include net credits for the effect of changes in tax laws and rates of $300 million in 2008, $258 million in 2007 and $169 million in 2006 and $199 million in 2005.2006.
Income taxes (charged)/credited directly to shareholders’ equity were:
| 2007 | 2006 | 2005 | 2008 | 2007 | 2006 | |||||||||||||||||||
| (millions of dollars) | (millions of dollars) | |||||||||||||||||||||||
Cumulative foreign exchange translation adjustment | $ | (269 | ) | $ | (36 | ) | $ | 158 | $ | 360 | $ | (269 | ) | $ | (36 | ) | ||||||||
Postretirement benefits reserves adjustment: | ||||||||||||||||||||||||
Net actuarial loss/(gain) | 102 | 3,361 | 102 | |||||||||||||||||||||
Amortization of actuarial loss/(gain) | (358 | ) | (317 | ) | (358 | ) | ||||||||||||||||||
Prior service cost | (23 | ) | 4 | (23 | ) | |||||||||||||||||||
Amortization of prior service cost | (60 | ) | (51 | ) | (60 | ) | ||||||||||||||||||
Foreign exchange rate changes | 132 | (274 | ) | 132 | ||||||||||||||||||||
Total postretirement benefits reserves adjustment | (207 | ) | 3,372 | — | 2,723 | (207 | ) | 3,372 | ||||||||||||||||
Minimum pension liability adjustment | — | (1,267 | ) | (90 | ) | — | — | (1,267 | ) | |||||||||||||||
Gains and losses on stock investments | — | — | 236 | |||||||||||||||||||||
Other components of shareholders’ equity | 113 | 169 | 224 | 315 | 113 | 169 | ||||||||||||||||||
The reconciliation between income tax expense and a theoretical U.S. tax computed by applying a rate of 35 percent for 2008, 2007 2006 and 2005,2006 is as follows:
| 2007 | 2006 | 2005 | 2008 | 2007 | 2006 | |||||||||||||||||||
| (millions of dollars) | (millions of dollars) | |||||||||||||||||||||||
Income before income taxes | ||||||||||||||||||||||||
United States | $ | 13,700 | $ | 15,507 | $ | 16,900 | $ | 10,141 | $ | 13,700 | $ | 15,507 | ||||||||||||
Non-U.S. | 56,774 | 51,895 | 42,532 | 71,609 | 56,774 | 51,895 | ||||||||||||||||||
Total | $ | 70,474 | $ | 67,402 | $ | 59,432 | $ | 81,750 | $ | 70,474 | $ | 67,402 | ||||||||||||
Theoretical tax | $ | 24,666 | $ | 23,591 | $ | 20,801 | $ | 28,613 | $ | 24,666 | $ | 23,591 | ||||||||||||
Effect of equity method of accounting | (3,115 | ) | (2,445 | ) | (2,654 | ) | (3,878 | ) | (3,115 | ) | (2,445 | ) | ||||||||||||
Non-U.S. taxes in excess of theoretical U.S. tax | 7,364 | 6,541 | 4,719 | 10,761 | 7,364 | 6,541 | ||||||||||||||||||
U.S. tax on non-U.S. operations | 263 | 239 | 208 | 230 | 263 | 239 | ||||||||||||||||||
State taxes, net of federal tax benefit | 410 | 512 | 522 | 300 | 410 | 512 | ||||||||||||||||||
Other U.S. | 276 | (536 | ) | (294 | ) | 504 | 276 | (536 | ) | |||||||||||||||
Total income tax expense | $ | 29,864 | $ | 27,902 | $ | 23,302 | $ | 36,530 | $ | 29,864 | $ | 27,902 | ||||||||||||
Effective tax rate calculation | ||||||||||||||||||||||||
Income taxes | $ | 29,864 | $ | 27,902 | $ | 23,302 | $ | 36,530 | $ | 29,864 | $ | 27,902 | ||||||||||||
ExxonMobil share of equity company income taxes | 2,547 | 1,920 | 2,226 | 4,001 | 2,547 | 1,920 | ||||||||||||||||||
Total income taxes | 32,411 | 29,822 | 25,528 | 40,531 | 32,411 | 29,822 | ||||||||||||||||||
Income from continuing operations | 40,610 | 39,500 | 36,130 | 45,220 | 40,610 | 39,500 | ||||||||||||||||||
Total income before taxes | $ | 73,021 | $ | 69,322 | $ | 61,658 | $ | 85,751 | $ | 73,021 | $ | 69,322 | ||||||||||||
Effective income tax rate | 44 | % | 43 | % | 41 | % | 47 | % | 44 | % | 43 | % | ||||||||||||
A52A51
NOTES TO CONSOLIDATED FINANCIAL STATEMENTS
Deferred income taxes reflect the impact of temporary differences between the amount of assets and liabilities recognized for financial reporting purposes and such amounts recognized for tax purposes.
Deferred tax liabilities/(assets) are comprised of the following at December 31:
Tax effects of temporary differences for: | 2007 | 2006 | 2008 | 2007 | ||||||||||||
| (millions of dollars) | (millions of dollars) | |||||||||||||||
Depreciation | $ | 18,810 | $ | 17,518 | $ | 17,279 | $ | 18,810 | ||||||||
Intangible development costs | 4,890 | 4,742 | 5,578 | 4,890 | ||||||||||||
Capitalized interest | 2,575 | 2,499 | 2,751 | 2,575 | ||||||||||||
Other liabilities | 3,955 | 3,240 | 3,589 | 3,955 | ||||||||||||
Total deferred tax liabilities | $ | 30,230 | $ | 27,999 | $ | 29,197 | $ | 30,230 | ||||||||
Pension and other postretirement benefits | $ | (3,837 | ) | $ | (4,135 | ) | $ | (6,275 | ) | $ | (3,837 | ) | ||||
Tax loss carryforwards | (2,162 | ) | (2,002 | ) | (2,850 | ) | (2,162 | ) | ||||||||
Other assets | (5,848 | ) | (4,894 | ) | (5,274 | ) | (5,848 | ) | ||||||||
Total deferred tax assets | $ | (11,847 | ) | $ | (11,031 | ) | $ | (14,399 | ) | $ | (11,847 | ) | ||||
Asset valuation allowances | 637 | 657 | 1,264 | 637 | ||||||||||||
Net deferred tax liabilities | $ | 19,020 | $ | 17,625 | $ | 16,062 | $ | 19,020 | ||||||||
Deferred income tax (assets) and liabilities are included in the balance sheet as shown below. Deferred income tax (assets) and liabilities are classified as current or long term consistent with the classification of the related temporary difference – separately by tax jurisdiction.
Balance sheet classification | 2007 | 2006 | 2008 | 2007 | ||||||||||||
| (millions of dollars) | (millions of dollars) | |||||||||||||||
Prepaid taxes and expenses | $ | (2,497 | ) | $ | (1,636 | ) | ||||||||||
Other current assets | $ | (2,097 | ) | $ | (2,497 | ) | ||||||||||
Other assets, including intangibles, net | (1,451 | ) | (1,656 | ) | (1,725 | ) | (1,451 | ) | ||||||||
Accounts payable and accrued liabilities | 69 | 66 | 158 | 69 | ||||||||||||
Deferred income tax liabilities | 22,899 | 20,851 | 19,726 | 22,899 | ||||||||||||
Net deferred tax liabilities | $ | 19,020 | $ | 17,625 | $ | 16,062 | $ | 19,020 | ||||||||
The Corporation had $56$62 billion of indefinitely reinvested, undistributed earnings from subsidiary companies outside the U.S. Unrecognized deferred taxes on remittance of these funds are not expected to be material.
Unrecognized Tax Benefits
Effective January 1, 2007, the Corporation adopted the Financial Accounting Standards Board’s Interpretation No. 48 (FIN 48), “Accounting for Uncertainty in Income Taxes.” Upon the adoption of FIN 48, the Corporation recognized a transition gain of $267 million in shareholders’ equity. The gain reflected the recognition of several refund claims, partly offset by increased liability reserves.
The Corporation is subject to income taxation in many jurisdictions around the world. The total amounts of unrecognizedUnrecognized tax benefits at January 1, 2007,reflect the difference between positions taken or expected to be taken on income tax returns and December 31, 2007, are shownthe amounts recognized in the following table.financial statements. Resolution of the related tax positions through negotiations with the relevant tax authorities or through litigation will take many years to complete. Accordingly, itIt is difficult to predict the timing of resolution for individual tax positions.positions since such timing is not entirely within the control of the Corporation. However, it is reasonably possible that resolutions could be reached with tax jurisdictions within the Corporation does not anticipatenext 12 months that could result in a decrease of up to 25 percent in the total amount of unrecognized tax benefits will significantly increase or decrease in the next 12 months.benefits. Given the long time periods involved in resolving individual tax positions, the Corporation does not expect that the recognition of unrecognized tax benefits will have a material impact on the Corporation’s effective income tax rate in any given year.
The following table summarizes the movement in uncertain tax benefits from January 1 to December 31, 2007. The unrecognized tax benefits are shown on both a gross basis and a net basis, reflecting the impact of funds placed on deposit with tax authorities. Such deposits do not acknowledge agreement with the tax authorities’ positions, but prevent further interest accretion on potential tax assessments. For balance sheet reporting, the Corporation reports unrecognized tax benefits net of such deposits where there is a legal right and intent to offset under the local tax law.benefits.
| Gross Unrecognized Tax Benefits | Deposits | Net Unrecognized Tax Benefits | ||||||||||
| (millions of dollars) | ||||||||||||
January 1, 2007, balance | $ | 4,583 | $ | (879 | ) | $ | 3,704 | |||||
Additions based on current year tax positions | 832 | 832 | ||||||||||
Additions for prior years’ tax positions | 463 | 463 | ||||||||||
Reductions for prior years’ tax positions | (609 | ) | (609 | ) | ||||||||
Reductions due to a lapse of the statute of limitations | (84 | ) | (84 | ) | ||||||||
Settlements with tax authorities | (25 | ) | (25 | ) | ||||||||
Foreign exchange effects/change in deposit balance | 72 | 109 | 181 | |||||||||
December 31, 2007, balance | $ | 5,232 | $ | (770 | ) | $ | 4,462 | |||||
Gross unrecognized tax benefits | 2008 | 2007 | ||||||
| (millions of dollars) | ||||||||
Balance at January 1 | $ | 5,232 | $ | 4,583 | ||||
Additions based on current year’s tax positions | 656 | 832 | ||||||
Additions for prior years’ tax positions | 294 | 463 | ||||||
Reductions for prior years’ tax positions | (328 | ) | (609 | ) | ||||
Reductions due to lapse of the statute of limitations | (27 | ) | (84 | ) | ||||
Settlements with tax authorities | (681 | ) | (25 | ) | ||||
Foreign exchange effects/other | (170 | ) | 72 | |||||
Balance at December 31 | $ | 4,976 | $ | 5,232 | ||||
The additions and reductions in unrecognized tax benefits shown above include effects related to net income and shareholders’ equity, and timing differences for which the ultimate deductibility is highly certain but for which there is uncertainty about the timing of such deductibility. The 2008 and 2007 changes in unrecognized tax benefits did not have a material effect on the Corporation’s net income or cash flow.
The following table summarizes the tax years that remain subject to examination by major tax jurisdiction:
Country of Operation | Open Tax Years | |
Abu Dhabi | 2000 - | |
Angola | 2002 - | |
Australia | 2000 - | |
Canada | ||
Equatorial Guinea | 2004 - | |
Germany | 1998 - | |
Japan | 2002 - | |
Malaysia | ||
Nigeria | 1998 - | |
Norway | 1993 - | |
United Kingdom | 2003 - | |
United States | 1989 - |
The Corporation classifies interest on income tax-related balances as interest expense or interest income and classifies tax-related penalties as operating expense.
The Corporation incurred approximately $137 million and $128 million in interest expense on income tax reserves in 2008 and 2007, respectively, and had a related interest payable of $671 million and $597 million at December 31, 2007.2008, and 2007, respectively.
A53A52
SUPPLEMENTAL INFORMATION ON OIL AND GAS EXPLORATION AND PRODUCTION ACTIVITIES(unaudited)
The results of operations for producing activities shown below are presented in accordance with Statement of Financial Accounting Standards No. 69. As such, they do not include earnings from other activities that ExxonMobil includes in the Upstream function such as oil and gas transportation operations, oil sands operations, LNG liquefaction and transportation operations, coal and power operations, technical services agreements, other nonoperating activities and adjustments for minority interests. These excluded amounts for both consolidated and equity companies totaled $3,834 million in 2008, $2,271 million in 2007 and $2,431 million in 2006 and $3,546 million in 2005.2006.
Results of Operations | United States | Canada/ South America | Europe | Africa | Asia Pacific/ Middle East | Russia/ Caspian | Total | United States | Canada/ South America | Europe | Africa | Asia Pacific/ Middle East | Russia/ Caspian | Total | ||||||||||||||||||||||||||||
| (millions of dollars) | ||||||||||||||||||||||||||||||||||||||||||
2008 – Revenue | ||||||||||||||||||||||||||||||||||||||||||
Sales to third parties | $ | 3,980 | $ | 4,591 | $ | 11,239 | $ | 2,284 | $ | 4,356 | $ | 746 | $ | 27,196 | ||||||||||||||||||||||||||||
Transfers | 8,525 | 3,518 | 10,859 | 18,361 | 9,083 | 2,026 | 52,372 | |||||||||||||||||||||||||||||||||||
| $ | 12,505 | $ | 8,109 | $ | 22,098 | $ | 20,645 | $ | 13,439 | $ | 2,772 | $ | 79,568 | |||||||||||||||||||||||||||||
Production costs excluding taxes | 2,143 | 1,686 | 2,623 | 1,603 | 1,152 | 280 | 9,487 | |||||||||||||||||||||||||||||||||||
Exploration expenses | 189 | 232 | 180 | 439 | 341 | 60 | 1,441 | |||||||||||||||||||||||||||||||||||
Depreciation and depletion | 1,303 | 906 | 2,510 | 2,471 | 794 | 350 | 8,334 | |||||||||||||||||||||||||||||||||||
Taxes other than income | 1,983 | 58 | 971 | 1,815 | 2,996 | 2 | 7,825 | |||||||||||||||||||||||||||||||||||
Related income tax | 3,191 | 1,501 | 10,715 | 8,119 | 5,248 | 508 | 29,282 | |||||||||||||||||||||||||||||||||||
Results of producing activities for consolidated subsidiaries | $ | 3,696 | $ | 3,726 | $ | 5,099 | $ | 6,198 | $ | 2,908 | $ | 1,572 | $ | 23,199 | ||||||||||||||||||||||||||||
Proportional interest in results of producing activities of equity companies | $ | 1,885 | $ | — | $ | 1,918 | $ | — | $ | 3,057 | $ | 1,509 | $ | 8,369 | ||||||||||||||||||||||||||||
| (millions of dollars) | ||||||||||||||||||||||||||||||||||||||||||
2007 – Revenue | ||||||||||||||||||||||||||||||||||||||||||
Sales to third parties | $ | 3,677 | $ | 3,720 | $ | 7,282 | $ | 807 | $ | 3,363 | $ | 678 | $ | 19,527 | $ | 3,677 | $ | 3,720 | $ | 7,282 | $ | 807 | $ | 3,363 | $ | 678 | $ | 19,527 | ||||||||||||||
Transfers | 6,554 | 2,783 | 9,780 | 17,048 | 7,276 | 2,087 | 45,528 | 6,554 | 2,783 | 9,780 | 17,048 | 7,276 | 2,087 | 45,528 | ||||||||||||||||||||||||||||
| $ | 10,231 | $ | 6,503 | $ | 17,062 | $ | 17,855 | $ | 10,639 | $ | 2,765 | $ | 65,055 | $ | 10,231 | $ | 6,503 | $ | 17,062 | $ | 17,855 | $ | 10,639 | $ | 2,765 | $ | 65,055 | |||||||||||||||
Production costs excluding taxes | 1,827 | 1,492 | 2,859 | 1,180 | 961 | 243 | 8,562 | 1,827 | 1,492 | 2,859 | 1,180 | 961 | 243 | 8,562 | ||||||||||||||||||||||||||||
Exploration expenses | 280 | 264 | 164 | 470 | 226 | 67 | 1,471 | 280 | 264 | 164 | 470 | 226 | 67 | 1,471 | ||||||||||||||||||||||||||||
Depreciation and depletion | 1,377 | 1,121 | 2,441 | 2,101 | 763 | 453 | 8,256 | 1,377 | 1,121 | 2,441 | 2,101 | 763 | 453 | 8,256 | ||||||||||||||||||||||||||||
Taxes other than income | 1,313 | 111 | 718 | 1,599 | 2,067 | 1 | 5,809 | 1,313 | 111 | 718 | 1,599 | 2,067 | 1 | 5,809 | ||||||||||||||||||||||||||||
Related income tax | 2,429 | 1,041 | 7,236 | 7,263 | 4,105 | 598 | 22,672 | 2,429 | 1,041 | 7,236 | 7,263 | 4,105 | 598 | 22,672 | ||||||||||||||||||||||||||||
Results of producing activities for consolidated subsidiaries | $ | 3,005 | $ | 2,474 | $ | 3,644 | $ | 5,242 | $ | 2,517 | $ | 1,403 | $ | 18,285 | $ | 3,005 | $ | 2,474 | $ | 3,644 | $ | 5,242 | $ | 2,517 | $ | 1,403 | $ | 18,285 | ||||||||||||||
Proportional interest in results of producing activities of equity companies | $ | 1,342 | $ | — | $ | 1,465 | $ | — | $ | 2,138 | $ | 996 | $ | 5,941 | $ | 1,342 | $ | — | $ | 1,465 | $ | — | $ | 2,138 | $ | 996 | $ | 5,941 | ||||||||||||||
2006 – Revenue | ||||||||||||||||||||||||||||||||||||||||||
Sales to third parties | $ | 4,027 | $ | 4,390 | $ | 9,382 | $ | 1,145 | $ | 4,393 | $ | 533 | $ | 23,870 | $ | 4,027 | $ | 4,390 | $ | 9,382 | $ | 1,145 | $ | 4,393 | $ | 533 | $ | 23,870 | ||||||||||||||
Transfers | 6,250 | 2,638 | 8,607 | 16,108 | 4,900 | 580 | 39,083 | 6,250 | 2,638 | 8,607 | 16,108 | 4,900 | 580 | 39,083 | ||||||||||||||||||||||||||||
| $ | 10,277 | $ | 7,028 | $ | 17,989 | $ | 17,253 | $ | 9,293 | $ | 1,113 | $ | 62,953 | $ | 10,277 | $ | 7,028 | $ | 17,989 | $ | 17,253 | $ | 9,293 | $ | 1,113 | $ | 62,953 | |||||||||||||||
Production costs excluding taxes | 1,916 | 1,410 | 2,290 | 965 | 824 | 118 | 7,523 | 1,916 | 1,410 | 2,290 | 965 | 824 | 118 | 7,523 | ||||||||||||||||||||||||||||
Exploration expenses | 245 | 172 | 161 | 330 | 157 | 116 | 1,181 | 245 | 172 | 161 | 330 | 157 | 116 | 1,181 | ||||||||||||||||||||||||||||
Depreciation and depletion | 1,155 | 1,023 | 2,166 | 2,096 | 674 | 305 | 7,419 | 1,155 | 1,023 | 2,166 | 2,096 | 674 | 305 | 7,419 | ||||||||||||||||||||||||||||
Taxes other than income | 802 | 139 | 846 | 1,612 | 2,652 | 1 | 6,052 | 802 | 139 | 846 | 1,612 | 2,652 | 1 | 6,052 | ||||||||||||||||||||||||||||
Related income tax | 2,711 | 1,143 | 8,032 | 6,878 | 2,820 | 217 | 21,801 | 2,711 | 1,143 | 8,032 | 6,878 | 2,820 | 217 | 21,801 | ||||||||||||||||||||||||||||
Results of producing activities for consolidated subsidiaries | $ | 3,448 | $ | 3,141 | $ | 4,494 | $ | 5,372 | $ | 2,166 | $ | 356 | $ | 18,977 | $ | 3,448 | $ | 3,141 | $ | 4,494 | $ | 5,372 | $ | 2,166 | $ | 356 | $ | 18,977 | ||||||||||||||
Proportional interest in results of producing activities of equity companies | $ | 1,236 | $ | — | $ | 1,164 | $ | — | $ | 1,555 | $ | 867 | $ | 4,822 | $ | 1,236 | $ | — | $ | 1,164 | $ | — | $ | 1,555 | $ | 867 | $ | 4,822 | ||||||||||||||
2005 – Revenue | ||||||||||||||||||||||||||||||||||||||||||
Sales to third parties | $ | 4,842 | $ | 3,728 | $ | 8,383 | $ | 40 | $ | 2,357 | $ | 357 | $ | 19,707 | ||||||||||||||||||||||||||||
Transfers | 6,277 | 3,582 | 7,040 | 12,293 | 3,143 | 279 | 32,614 | |||||||||||||||||||||||||||||||||||
| $ | 11,119 | $ | 7,310 | $ | 15,423 | $ | 12,333 | $ | 5,500 | $ | 636 | $ | 52,321 | |||||||||||||||||||||||||||||
Production costs excluding taxes | 1,367 | 1,370 | 2,174 | 840 | 567 | 123 | 6,441 | |||||||||||||||||||||||||||||||||||
Exploration expenses | 158 | 137 | 64 | 310 | 122 | 164 | 955 | |||||||||||||||||||||||||||||||||||
Depreciation and depletion | 1,181 | 1,041 | 2,133 | 1,319 | 666 | 137 | 6,477 | |||||||||||||||||||||||||||||||||||
Taxes other than income | 738 | 56 | 690 | 1,158 | 839 | 2 | 3,483 | |||||||||||||||||||||||||||||||||||
Related income tax | 3,138 | 1,641 | 6,572 | 5,143 | 1,313 | 111 | 17,918 | |||||||||||||||||||||||||||||||||||
Results of producing activities for consolidated subsidiaries | $ | 4,537 | $ | 3,065 | $ | 3,790 | $ | 3,563 | $ | 1,993 | $ | 99 | $ | 17,047 | ||||||||||||||||||||||||||||
Proportional interest in results of producing activities of equity companies | $ | 1,043 | $ | — | $ | 1,003 | $ | — | $ | 1,009 | $ | 701 | $ | 3,756 | ||||||||||||||||||||||||||||
A54A53
SUPPLEMENTAL INFORMATION ON OIL AND GAS EXPLORATION AND PRODUCTION ACTIVITIES(unaudited)
Average sales prices have been calculated by using sales quantities from the Corporation’s own production as the divisor. Average production costs have been computed by using net production quantities for the divisor.divisor . The volumes of crude oil and natural gas liquids (NGL) production used for this computation are shown in the proved reserves table of this report. The volumes for natural gas used for this calculation are the production volumes of natural gas available for sale and thus are different than those shown in the proved reserves table of this report due to volumes consumed or flared. The volumes of natural gas were converted to oil-equivalent barrels based on a conversion factor of six thousand cubic feet per barrel.
Average sales prices and production costs per unit of production – consolidated subsidiaries | United States | Canada/ South America | Europe | Africa | Asia Pacific/ Middle East | Russia/ Caspian | Total | United States | Canada/ South America | Europe | Africa | Asia Pacific/ Middle East | Russia/ Caspian | Total | ||||||||||||||||||||||||||||
During 2008 | ||||||||||||||||||||||||||||||||||||||||||
Average sales prices | ||||||||||||||||||||||||||||||||||||||||||
Crude oil and NGL, per barrel | $ | 87.41 | $ | 76.24 | $ | 89.65 | $ | 92.69 | $ | 92.28 | $ | 94.20 | $ | 89.32 | ||||||||||||||||||||||||||||
Natural gas, per thousand cubic feet | 7.22 | 7.82 | 10.12 | 3.33 | 4.55 | 2.08 | 7.54 | |||||||||||||||||||||||||||||||||||
Average production costs, per barrel(1) | 11.80 | 13.70 | 8.97 | 6.66 | 5.19 | 9.64 | 8.72 | |||||||||||||||||||||||||||||||||||
During 2007 | ||||||||||||||||||||||||||||||||||||||||||
Average sales prices | ||||||||||||||||||||||||||||||||||||||||||
Crude oil and NGL, per barrel | $ | 62.35 | $ | 50.41 | $ | 68.01 | $ | 70.00 | $ | 69.58 | $ | 69.15 | $ | 66.02 | $ | 62.35 | $ | 50.41 | $ | 68.01 | $ | 70.00 | $ | 69.58 | $ | 69.15 | $ | 66.02 | ||||||||||||||
Natural gas, per thousand cubic feet | 5.93 | 5.77 | 6.22 | 2.26 | 3.54 | 1.79 | 5.29 | 5.93 | 5.77 | 6.22 | 2.26 | 3.54 | 1.79 | 5.29 | ||||||||||||||||||||||||||||
Average production costs, per barrel(1) | 9.03 | 10.38 | 9.12 | 4.48 | 4.09 | 5.79 | 7.14 | 9.03 | 10.38 | 9.12 | 4.48 | 4.09 | 5.79 | 7.14 | ||||||||||||||||||||||||||||
During 2006 | ||||||||||||||||||||||||||||||||||||||||||
Average sales prices | ||||||||||||||||||||||||||||||||||||||||||
Crude oil and NGL, per barrel | $ | 55.13 | $ | 47.70 | $ | 59.90 | $ | 61.26 | $ | 62.02 | $ | 57.38 | $ | 58.34 | $ | 55.13 | $ | 47.70 | $ | 59.90 | $ | 61.26 | $ | 62.02 | $ | 57.38 | $ | 58.34 | ||||||||||||||
Natural gas, per thousand cubic feet | 6.22 | 5.81 | 7.48 | — | 3.87 | 2.31 | 6.08 | 6.22 | 5.81 | 7.48 | — | 3.87 | 2.31 | 6.08 | ||||||||||||||||||||||||||||
Average production costs, per barrel(1) | 8.78 | 8.55 | 6.64 | 3.39 | 3.90 | 5.45 | 6.04 | 8.78 | 8.55 | 6.64 | 3.39 | 3.90 | 5.45 | 6.04 | ||||||||||||||||||||||||||||
During 2005 | ||||||||||||||||||||||||||||||||||||||||||
Average sales prices | ||||||||||||||||||||||||||||||||||||||||||
Crude oil and NGL, per barrel | $ | 46.11 | $ | 38.68 | $ | 50.32 | $ | 51.21 | $ | 52.89 | $ | 51.65 | $ | 48.23 | ||||||||||||||||||||||||||||
Natural gas, per thousand cubic feet | 7.30 | 6.90 | 5.64 | — | 4.16 | 1.35 | 5.96 | |||||||||||||||||||||||||||||||||||
Average production costs, per barrel(1) | 5.56 | 7.36 | 5.95 | 3.46 | 3.85 | 9.49 | 5.36 | |||||||||||||||||||||||||||||||||||
| (1) | Production costs exclude depreciation and depletion and all taxes. Natural gas included by conversion to crude oil-equivalent. |
A55A54
SUPPLEMENTAL INFORMATION ON OIL AND GAS EXPLORATION AND PRODUCTION ACTIVITIES(unaudited)
Oil and Gas Exploration and Production Costs
The amounts shown for net capitalized costs of consolidated subsidiaries are $5,779 million less at year-end 2008 and $6,381 million less at year-end 2007 and $5,463 million less at year-end 2006 than the amounts reported as investments in property, plant and equipment for the Upstream in note 8. This is due to the exclusion from capitalized costs of certain transportation and research assets and assets relating to the oil sands and LNG operations, all as required by Statement of Financial Accounting Standards No. 19.
Capitalized Costs | United States | Canada/ South America | Europe | Africa | Asia Pacific/ Middle East | Russia/ Caspian | Total | United States | Canada/ South America | Europe | Africa | Asia Pacific/ Middle East | Russia/ Caspian | Total | ||||||||||||||||||||||||||||
| (millions of dollars) | ||||||||||||||||||||||||||||||||||||||||||
As of December 31, 2008 | ||||||||||||||||||||||||||||||||||||||||||
Property (acreage) costs – Proved | $ | 3,238 | $ | 3,431 | $ | 182 | $ | 316 | $ | 601 | $ | 552 | $ | 8,320 | ||||||||||||||||||||||||||||
– Unproved | 647 | 569 | 48 | 461 | 991 | 45 | 2,761 | |||||||||||||||||||||||||||||||||||
Total property costs | $ | 3,885 | $ | 4,000 | $ | 230 | $ | 777 | $ | 1,592 | $ | 597 | $ | 11,081 | ||||||||||||||||||||||||||||
Producing assets | 37,402 | 13,410 | 34,846 | 24,219 | 15,964 | 3,400 | 129,241 | |||||||||||||||||||||||||||||||||||
Support facilities | 712 | 227 | 513 | 481 | 1,639 | 429 | 4,001 | |||||||||||||||||||||||||||||||||||
Incomplete construction | 2,858 | 997 | 874 | 3,996 | 4,060 | 3,660 | 16,445 | |||||||||||||||||||||||||||||||||||
Total capitalized costs | $ | 44,857 | $ | 18,634 | $ | 36,463 | $ | 29,473 | $ | 23,255 | $ | 8,086 | $ | 160,768 | ||||||||||||||||||||||||||||
Accumulated depreciation and depletion | 28,323 | 11,987 | 26,390 | 11,676 | 13,366 | 1,392 | 93,134 | |||||||||||||||||||||||||||||||||||
Net capitalized costs for consolidated subsidiaries | $ | 16,534 | $ | 6,647 | $ | 10,073 | $ | 17,797 | $ | 9,889 | $ | 6,694 | $ | 67,634 | ||||||||||||||||||||||||||||
Proportional interest of net capitalized costs of equity companies | $ | 2,008 | $ | — | $ | 1,404 | $ | — | $ | 1,490 | $ | 3,525 | $ | 8,427 | ||||||||||||||||||||||||||||
| (millions of dollars) | ||||||||||||||||||||||||||||||||||||||||||
As of December 31, 2007 | ||||||||||||||||||||||||||||||||||||||||||
Property (acreage) costs – Proved | $ | 3,227 | $ | 4,102 | $ | 272 | $ | 200 | $ | 1,172 | $ | 521 | $ | 9,494 | $ | 3,227 | $ | 4,102 | $ | 272 | $ | 200 | $ | 1,172 | $ | 521 | $ | 9,494 | ||||||||||||||
– Unproved | 556 | 524 | 30 | 540 | 1,142 | 45 | 2,837 | 556 | 524 | 30 | 540 | 1,142 | 45 | 2,837 | ||||||||||||||||||||||||||||
Total property costs | $ | 3,783 | $ | 4,626 | $ | 302 | $ | 740 | $ | 2,314 | $ | 566 | $ | 12,331 | $ | 3,783 | $ | 4,626 | $ | 302 | $ | 740 | $ | 2,314 | $ | 566 | $ | 12,331 | ||||||||||||||
Producing assets | 35,830 | 15,370 | 48,673 | 19,633 | 17,302 | 2,796 | 139,604 | 35,830 | 15,370 | 48,673 | 19,633 | 17,302 | 2,796 | 139,604 | ||||||||||||||||||||||||||||
Support facilities | 694 | 269 | 619 | 461 | 1,186 | 428 | 3,657 | 694 | 269 | 619 | 461 | 1,186 | 428 | 3,657 | ||||||||||||||||||||||||||||
Incomplete construction | 2,406 | 950 | 891 | 3,576 | 3,133 | 3,040 | 13,996 | 2,406 | 950 | 891 | 3,576 | 3,133 | 3,040 | 13,996 | ||||||||||||||||||||||||||||
Total capitalized costs | $ | 42,713 | $ | 21,215 | $ | 50,485 | $ | 24,410 | $ | 23,935 | $ | 6,830 | $ | 169,588 | $ | 42,713 | $ | 21,215 | $ | 50,485 | $ | 24,410 | $ | 23,935 | $ | 6,830 | $ | 169,588 | ||||||||||||||
Accumulated depreciation and depletion | 27,427 | 13,529 | 36,520 | 9,261 | 14,674 | 1,034 | 102,445 | 27,427 | 13,529 | 36,520 | 9,261 | 14,674 | 1,034 | 102,445 | ||||||||||||||||||||||||||||
Net capitalized costs for consolidated subsidiaries | $ | 15,286 | $ | 7,686 | $ | 13,965 | $ | 15,149 | $ | 9,261 | $ | 5,796 | $ | 67,143 | $ | 15,286 | $ | 7,686 | $ | 13,965 | $ | 15,149 | $ | 9,261 | $ | 5,796 | $ | 67,143 | ||||||||||||||
Proportional interest of net capitalized costs of equity companies | $ | 1,662 | $ | — | $ | 1,461 | $ | — | $ | 1,413 | $ | 3,346 | $ | 7,882 | $ | 1,662 | $ | — | $ | 1,461 | $ | — | $ | 1,413 | $ | 3,346 | $ | 7,882 | ||||||||||||||
As of December 31, 2006 | ||||||||||||||||||||||||||||||||||||||||||
Property (acreage) costs – Proved | $ | 3,260 | $ | 3,532 | $ | 277 | $ | 200 | $ | 1,164 | $ | 512 | $ | 8,945 | ||||||||||||||||||||||||||||
– Unproved | 574 | 429 | 31 | 523 | 1,070 | 99 | 2,726 | |||||||||||||||||||||||||||||||||||
Total property costs | $ | 3,834 | $ | 3,961 | $ | 308 | $ | 723 | $ | 2,234 | $ | 611 | $ | 11,671 | ||||||||||||||||||||||||||||
Producing assets | 34,852 | 12,800 | 44,719 | 16,748 | 16,295 | 2,324 | 127,738 | |||||||||||||||||||||||||||||||||||
Support facilities | 740 | 257 | 581 | 442 | 1,158 | 308 | 3,486 | |||||||||||||||||||||||||||||||||||
Incomplete construction | 2,273 | 893 | 1,439 | 3,533 | 1,537 | 2,605 | 12,280 | |||||||||||||||||||||||||||||||||||
Total capitalized costs | $ | 41,699 | $ | 17,911 | $ | 47,047 | $ | 21,446 | $ | 21,224 | $ | 5,848 | $ | 155,175 | ||||||||||||||||||||||||||||
Accumulated depreciation and depletion | 26,696 | 10,780 | 33,302 | 7,166 | 13,649 | 635 | 92,228 | |||||||||||||||||||||||||||||||||||
Net capitalized costs for consolidated subsidiaries | $ | 15,003 | $ | 7,131 | $ | 13,745 | $ | 14,280 | $ | 7,575 | $ | 5,213 | $ | 62,947 | ||||||||||||||||||||||||||||
Proportional interest of net capitalized costs of equity companies | $ | 1,527 | $ | — | $ | 1,437 | $ | — | $ | 1,238 | $ | 3,033 | $ | 7,235 | ||||||||||||||||||||||||||||
A56A55
SUPPLEMENTAL INFORMATION ON OIL AND GAS EXPLORATION AND PRODUCTION ACTIVITIES(unaudited)
Oil and Gas Exploration and Production Costs(continued)
The amounts reported as costs incurred include both capitalized costs and costs charged to expense during the year. Costs incurred also include new asset retirement obligations established in the current year, as well as increases or decreases to the asset retirement obligation resulting from changes in cost estimates or abandonment date. Total consolidated costs incurred in 2008 were $15,816 million, up $3,741 million from 2007, due primarily to higher exploration and development costs. 2007 costs were $12,075 million, down $938 million from 2006, due primarily to lower development and property acquisition costs. 2006 costs were $13,013 million, up $2,229 million from 2005, due primarily to higher development and property acquisition costs.
Costs incurred in property acquisitions, exploration and development activities | United States | Canada/ South America | Europe | Africa | Asia Pacific/ Middle East | Russia/ Caspian | Total | United States | Canada/ South America | Europe | Africa | Asia Pacific/ Middle East | Russia/ Caspian | Total | ||||||||||||||||||||||||||||
| (millions of dollars) | ||||||||||||||||||||||||||||||||||||||||||
During 2008 | ||||||||||||||||||||||||||||||||||||||||||
Property acquisition costs – Proved | $ | — | $ | 1 | $ | — | $ | — | $ | 5 | $ | 55 | $ | 61 | ||||||||||||||||||||||||||||
– Unproved | 281 | 125 | 25 | 82 | 81 | 8 | 602 | |||||||||||||||||||||||||||||||||||
Exploration costs | 453 | 306 | 389 | 686 | 346 | 61 | 2,241 | |||||||||||||||||||||||||||||||||||
Development costs | 2,255 | 907 | 1,634 | 4,783 | 1,904 | 1,429 | 12,912 | |||||||||||||||||||||||||||||||||||
Total costs incurred for consolidated subsidiaries | $ | 2,989 | $ | 1,339 | $ | 2,048 | $ | 5,551 | $ | 2,336 | $ | 1,553 | $ | 15,816 | ||||||||||||||||||||||||||||
Proportional interest of costs incurred of equity companies | $ | 484 | $ | — | $ | 241 | $ | — | $ | 159 | $ | 335 | $ | 1,219 | ||||||||||||||||||||||||||||
| (millions of dollars) | ||||||||||||||||||||||||||||||||||||||||||
During 2007 | ||||||||||||||||||||||||||||||||||||||||||
Property acquisition costs – Proved | $ | 24 | $ | — | $ | — | $ | 3 | $ | — | $ | 10 | $ | 37 | $ | 24 | $ | — | $ | — | $ | 3 | $ | — | $ | 10 | $ | 37 | ||||||||||||||
– Unproved | 39 | 93 | — | 10 | 15 | — | 157 | 39 | 93 | — | 10 | 15 | — | 157 | ||||||||||||||||||||||||||||
Exploration costs | 375 | 222 | 201 | 584 | 261 | 80 | 1,723 | 375 | 222 | 201 | 584 | 261 | 80 | 1,723 | ||||||||||||||||||||||||||||
Development costs | 1,558 | 645 | 1,826 | 2,846 | 2,156 | 1,127 | 10,158 | 1,558 | 645 | 1,826 | 2,846 | 2,156 | 1,127 | 10,158 | ||||||||||||||||||||||||||||
Total costs incurred for consolidated subsidiaries | $ | 1,996 | $ | 960 | $ | 2,027 | $ | 3,443 | $ | 2,432 | $ | 1,217 | $ | 12,075 | $ | 1,996 | $ | 960 | $ | 2,027 | $ | 3,443 | $ | 2,432 | $ | 1,217 | $ | 12,075 | ||||||||||||||
Proportional interest of costs incurred of equity companies | $ | 303 | $ | — | $ | 218 | $ | 1 | $ | 249 | $ | 414 | $ | 1,185 | $ | 303 | $ | — | $ | 218 | $ | 1 | $ | 249 | $ | 414 | $ | 1,185 | ||||||||||||||
During 2006 | ||||||||||||||||||||||||||||||||||||||||||
Property acquisition costs – Proved | $ | 11 | $ | — | $ | 6 | $ | — | $ | 206 | $ | 11 | $ | 234 | $ | 11 | $ | — | $ | 6 | $ | — | $ | 206 | $ | 11 | $ | 234 | ||||||||||||||
– Unproved | 43 | — | 5 | 16 | 199 | — | 263 | 43 | — | 5 | 16 | 199 | — | 263 | ||||||||||||||||||||||||||||
Exploration costs | 380 | 225 | 178 | 518 | 219 | 126 | 1,646 | 380 | 225 | 178 | 518 | 219 | 126 | 1,646 | ||||||||||||||||||||||||||||
Development costs | 1,555 | 850 | 2,443 | 3,433 | 1,475 | 1,114 | 10,870 | 1,555 | 850 | 2,443 | 3,433 | 1,475 | 1,114 | 10,870 | ||||||||||||||||||||||||||||
Total costs incurred for consolidated subsidiaries | $ | 1,989 | $ | 1,075 | $ | 2,632 | $ | 3,967 | $ | 2,099 | $ | 1,251 | $ | 13,013 | $ | 1,989 | $ | 1,075 | $ | 2,632 | $ | 3,967 | $ | 2,099 | $ | 1,251 | $ | 13,013 | ||||||||||||||
Proportional interest of costs incurred of equity companies | $ | 285 | $ | — | $ | 241 | $ | — | $ | 243 | $ | 351 | $ | 1,120 | $ | 285 | $ | — | $ | 241 | $ | — | $ | 243 | $ | 351 | $ | 1,120 | ||||||||||||||
During 2005 | ||||||||||||||||||||||||||||||||||||||||||
Property acquisition costs – Proved | $ | — | $ | — | $ | — | $ | — | $ | — | $ | 174 | $ | 174 | ||||||||||||||||||||||||||||
– Unproved | 11 | 18 | — | 53 | 41 | 156 | 279 | |||||||||||||||||||||||||||||||||||
Exploration costs | 286 | 121 | 133 | 507 | 171 | 159 | 1,377 | |||||||||||||||||||||||||||||||||||
Development costs | 1,426 | 722 | 1,302 | 3,189 | 541 | 1,774 | 8,954 | |||||||||||||||||||||||||||||||||||
Total costs incurred for consolidated subsidiaries | $ | 1,723 | $ | 861 | $ | 1,435 | $ | 3,749 | $ | 753 | $ | 2,263 | $ | 10,784 | ||||||||||||||||||||||||||||
Proportional interest of costs incurred of equity companies | $ | 269 | $ | — | $ | 210 | $ | — | $ | 319 | $ | 384 | $ | 1,182 | ||||||||||||||||||||||||||||
A57A56
SUPPLEMENTAL INFORMATION ON OIL AND GAS EXPLORATION AND PRODUCTION ACTIVITIES (unaudited)
Oil and Gas Reserves
The following information describes changes during the years and balances of proved oil and gas reserves at year-end 2005, 2006, 2007 and 2007.2008.
The definitions used are in accordance with the Securities and Exchange Commission’s Rule 4-10 (a) of Regulation S-X, paragraphs (2) through (2)iii, (3) and (4).
Proved oil and gas reserves are the estimated quantities of crude oil, natural gas and natural gas liquids that geological and engineering data demonstrate with reasonable certainty to be recoverable in future years from known reservoirs under existing economic and operating conditions, i.e., prices and costs as of the date the estimate is made. Prices include consideration of changes in existing prices provided only by contractual arrangements but not on escalations based upon future conditions. In some cases, substantial new investments in additional wells and related facilities will be required to recover these proved reserves.
The year-end reserves volumes as well as the reserves change categories shown in the following tables are calculated using December 31 prices and costs. These reserves quantities are also used in calculating unit-of-production depreciation rates and in calculating the standardized measure of discounted net cash flow. We understand that the use of December 31 prices and costs is intended to provide a point in time measure to calculate reserves and to enhance comparability between companies.
Regulations preclude However, the Corporation from showing in this document, however, the reserves that are calculated in a manner that is consistent with the basis that the Corporation uses to make its investment decisions. The use of year-end prices for reserves estimation introduces short-term price volatility into the process, which is inconsistent with the long-term nature of the upstream business, since annual adjustments are required based on prices occurring on a single day. The Corporation believes that this approach is inconsistent withAs a result, the long-term nature of the upstream business where production from individual projects often spans multiple decades. The use of prices from a single date is not relevant to the investment decisions made by the Corporation and annual variations in reserves based on such year-end prices are not of consequence to how the business is actually managed.Corporation.
Revisions can include upward or downward changes in previously estimated volumes of proved reserves for existing fields due to the evaluation or re-evaluation of (1) already available geologic, reservoir or production data, (2) new geologic, reservoir or production data or (3) changes in year-end prices and costs that are used in the determination of reserves. This category can also include changes associated with the performance of improved recovery projects and significant changes in either development strategy or production equipment/facility capacity.
Proved reserves include 100 percent of each majority-owned affiliate’s participation in proved reserves and ExxonMobil’s ownership percentage of the proved reserves of equity companies, but exclude royalties and quantities due others. Gas reserves exclude the gaseous equivalent of liquids expected to be removed from the gas on leases, at field facilities and at gas processing plants. These liquids are included in net proved reserves of crude oil and natural gas liquids.
In the proved reserves tables, consolidated reserves and equity company reserves are reported separately. However, the Corporation does not view equity company reserves any differently than those from consolidated companies.
Reserves reported under production sharing and other nonconcessionary agreements are based on the economic interest as defined by the specific fiscal terms in the agreement. The percentage of conventional liquids and natural gas proved reserves (consolidated subsidiaries plus equity companies) at year-end 20072008 that were associated with production sharing contract arrangements was 1822 percent of liquids, 1316 percent of natural gas and 1519 percent on an oil-equivalent basis (gas converted to oil-equivalent at 6 billion cubic feet = 1 million barrels).
Net proved developed reserves are those volumes that are expected to be recovered through existing wells with existing equipment and operating methods. Undeveloped reserves are those volumes that are expected to be recovered as a result of future investments to drill new wells, to recomplete existing wells and/or to install facilities to collect and deliver the production from existing and future wells.
Crude oil and natural gas liquids and natural gas production quantities shown are the net volumes withdrawn from ExxonMobil’s oil and gas reserves. The natural gas quantities differ from the quantities of gas delivered for sale by the producing function as reported in the Operating Summary due to volumes consumed or flared and inventory changes.
A58A57
Crude Oil and Natural Gas Liquids | United States | Canada/ South America (1) | Europe | Africa | Asia Pacific/ Middle East | Russia/ Caspian | Total | ||||||||||||||
| (millions of barrels) | |||||||||||||||||||||
Net proved developed and undeveloped reserves of consolidated subsidiaries | |||||||||||||||||||||
January 1, 2005 | 2,593 | 1,105 | 1,014 | 2,444 | 515 | 724 | 8,395 | ||||||||||||||
Revisions | (256 | ) | 336 | 17 | (8 | ) | 78 | (27 | ) | 140 | |||||||||||
Purchases | — | — | — | — | — | 93 | 93 | ||||||||||||||
Sales | (96 | ) | (49 | ) | (1 | ) | — | (11 | ) | (70 | ) | (227 | ) | ||||||||
Improved recovery | 2 | — | 3 | — | — | — | 5 | ||||||||||||||
Extensions and discoveries | 6 | 16 | 47 | 120 | — | — | 189 | ||||||||||||||
Production | (136 | ) | (125 | ) | (197 | ) | (244 | ) | (67 | ) | (13 | ) | (782 | ) | |||||||
December 31, 2005 | 2,113 | 1,283 | 883 | 2,312 | 515 | 707 | 7,813 | ||||||||||||||
Revisions | (99 | ) | 247 | 50 | 24 | 19 | 105 | 346 | |||||||||||||
Purchases | 4 | — | 8 | — | 734 | — | 746 | ||||||||||||||
Sales | (41 | ) | (27 | ) | (18 | ) | — | — | — | (86 | ) | ||||||||||
Improved recovery | 21 | — | — | — | — | — | 21 | ||||||||||||||
Extensions and discoveries | 2 | — | 13 | 38 | 133 | — | 186 | ||||||||||||||
Production | (116 | ) | (108 | ) | (188 | ) | (285 | ) | (114 | ) | (21 | ) | (832 | ) | |||||||
December 31, 2006 | 1,884 | 1,395 | 748 | 2,089 | 1,287 | 791 | 8,194 | ||||||||||||||
Revisions | 76 | 15 | 89 | 99 | 342 | (38 | ) | 583 | |||||||||||||
Purchases | — | — | — | — | — | — | — | ||||||||||||||
Sales | (8 | ) | (426 | )(2) | (1 | ) | — | — | — | (435 | ) | ||||||||||
Improved recovery | 8 | 5 | 8 | 4 | — | — | 25 | ||||||||||||||
Extensions and discoveries | 2 | 45 | 2 | 128 | 1 | — | 178 | ||||||||||||||
Production | (111 | ) | (95 | ) | (173 | ) | (262 | ) | (120 | ) | (40 | ) | (801 | ) | |||||||
December 31, 2007 | 1,851 | 939 | 673 | 2,058 | 1,510 | 713 | 7,744 | ||||||||||||||
Proportional interest in proved reserves of equity companies | |||||||||||||||||||||
End of year 2005 | 413 | — | 11 | — | 1,381 | 873 | 2,678 | ||||||||||||||
End of year 2006 | 391 | — | 12 | — | 1,412 | 841 | 2,656 | ||||||||||||||
End of year 2007 | 374 | — | 26 | — | 1,428 | 808 | 2,636 | ||||||||||||||
Proved developed reserves, included above, as of December 31, 2005 | |||||||||||||||||||||
Consolidated subsidiaries | 1,680 | 834 | 656 | 1,218 | 464 | 55 | 4,907 | ||||||||||||||
Equity companies | 326 | — | 9 | — | 725 | 574 | 1,634 | ||||||||||||||
Proved developed reserves, included above, as of December 31, 2006 | |||||||||||||||||||||
Consolidated subsidiaries | 1,466 | 902 | 557 | 1,279 | 1,090 | 108 | 5,402 | ||||||||||||||
Equity companies | 311 | — | 11 | — | 630 | 544 | 1,496 | ||||||||||||||
Proved developed reserves, included above, as of December 31, 2007 | |||||||||||||||||||||
Consolidated subsidiaries | 1,327 | 682 | 518 | 1,202 | 1,127 | 91 | 4,947 | ||||||||||||||
Equity companies | 299 | — | 8 | — | 670 | 511 | 1,488 | ||||||||||||||
SUPPLEMENTAL INFORMATION ON OIL AND GAS EXPLORATION AND PRODUCTION ACTIVITIES(unaudited)
Crude Oil and Natural Gas Liquids | United States | Canada/ South America (1) | Europe | Africa | Asia Pacific/ Middle East | Russia/ Caspian | Total | ||||||||||||||
| (millions of barrels) | |||||||||||||||||||||
Net proved developed and undeveloped reserves of consolidated subsidiaries | |||||||||||||||||||||
January 1, 2006 | 2,113 | 1,283 | 883 | 2,312 | 515 | 707 | 7,813 | ||||||||||||||
Revisions | (99 | ) | 247 | 50 | 24 | 19 | 105 | 346 | |||||||||||||
Purchases | 4 | — | 8 | — | 734 | — | 746 | ||||||||||||||
Sales | (41 | ) | (27 | ) | (18 | ) | — | — | — | (86 | ) | ||||||||||
Improved recovery | 21 | — | — | — | — | — | 21 | ||||||||||||||
Extensions and discoveries | 2 | — | 13 | 38 | 133 | — | 186 | ||||||||||||||
Production | (116 | ) | (108 | ) | (188 | ) | (285 | ) | (114 | ) | (21 | ) | (832 | ) | |||||||
December 31, 2006 | 1,884 | 1,395 | 748 | 2,089 | 1,287 | 791 | 8,194 | ||||||||||||||
Revisions | 76 | 15 | 89 | 99 | 342 | (38 | ) | 583 | |||||||||||||
Purchases | — | — | — | — | — | — | — | ||||||||||||||
Sales | (8 | ) | (426 | )(2) | (1 | ) | — | — | — | (435 | ) | ||||||||||
Improved recovery | 8 | 5 | 8 | 4 | — | — | 25 | ||||||||||||||
Extensions and discoveries | 2 | 45 | 2 | 128 | 1 | — | 178 | ||||||||||||||
Production | (111 | ) | (95 | ) | (173 | ) | (262 | ) | (120 | ) | (40 | ) | (801 | ) | |||||||
December 31, 2007 | 1,851 | 939 | 673 | 2,058 | 1,510 | 713 | 7,744 | ||||||||||||||
Revisions | (104 | ) | (70 | ) | 39 | 253 | 274 | 79 | 471 | ||||||||||||
Purchases | — | — | — | — | — | — | — | ||||||||||||||
Sales | (4 | ) | (2 | ) | (28 | ) | — | — | (52 | ) | (86 | ) | |||||||||
Improved recovery | — | — | — | — | — | — | — | ||||||||||||||
Extensions and discoveries | 5 | 29 | 4 | 65 | 68 | — | 171 | ||||||||||||||
Production | (104 | ) | (84 | ) | (155 | ) | (239 | ) | (115 | ) | (27 | ) | (724 | ) | |||||||
December 31, 2008 | 1,644 | 812 | 533 | 2,137 | 1,737 | 713 | 7,576 | ||||||||||||||
Proportional interest in proved reserves of equity companies | |||||||||||||||||||||
End of year 2006 | 391 | — | 12 | — | 1,412 | 841 | 2,656 | ||||||||||||||
End of year 2007 | 374 | — | 26 | — | 1,428 | 808 | 2,636 | ||||||||||||||
End of year 2008 | 327 | — | 27 | — | 1,335 | 870 | 2,559 | ||||||||||||||
Proved developed reserves, included above, as of December 31, 2006 | |||||||||||||||||||||
Consolidated subsidiaries | 1,466 | 902 | 557 | 1,279 | 1,090 | 108 | 5,402 | ||||||||||||||
Equity companies | 311 | — | 11 | — | 630 | 544 | 1,496 | ||||||||||||||
Proved developed reserves, included above, as of December 31, 2007 | |||||||||||||||||||||
Consolidated subsidiaries | 1,327 | 682 | 518 | 1,202 | 1,127 | 91 | 4,947 | ||||||||||||||
Equity companies | 299 | — | 8 | — | 670 | 511 | 1,488 | ||||||||||||||
Proved developed reserves, included above, as of December 31, 2008 | |||||||||||||||||||||
Consolidated subsidiaries | 1,257 | 580 | 410 | 1,284 | 1,157 | 105 | 4,793 | ||||||||||||||
Equity companies | 264 | — | 9 | — | 807 | 610 | 1,690 | ||||||||||||||
| (1) | Includes total proved reserves attributable to Imperial Oil Limited of |
| (2) | Includes 425 million barrels of proved reserves in Venezuela which were expropriated. See note 15, Litigation and Other Contingencies. |
A59A58
SUPPLEMENTAL INFORMATION ON OIL AND GAS EXPLORATION AND PRODUCTION ACTIVITIES(unaudited)
Oil and Gas Reserves(continued)
Natural Gas | United States | Canada/ South America (1) | Europe | Africa | Asia Pacific/ Middle East | Russia/ Caspian | Total | United States | Canada/ South America (1) | Europe | Africa | Asia Pacific/ Middle East | Russia/ Caspian | Total | ||||||||||||||||||||||||||||
| (billions of cubic feet) | (billions of cubic feet) | |||||||||||||||||||||||||||||||||||||||||
Net proved developed and undeveloped reserves of consolidated subsidiaries | ||||||||||||||||||||||||||||||||||||||||||
January 1, 2005 | 12,329 | 2,652 | 9,185 | 771 | 6,391 | 515 | 31,843 | |||||||||||||||||||||||||||||||||||
Revisions | 1,943 | 83 | 242 | 35 | 1,402 | (18 | ) | 3,687 | ||||||||||||||||||||||||||||||||||
Purchases | — | — | — | — | — | 53 | 53 | |||||||||||||||||||||||||||||||||||
Sales | (105 | ) | (25 | ) | (73 | ) | — | — | (26 | ) | (229 | ) | ||||||||||||||||||||||||||||||
Improved recovery | — | — | — | — | — | — | — | |||||||||||||||||||||||||||||||||||
Extensions and discoveries | 289 | 26 | 116 | 57 | 32 | 300 | 820 | |||||||||||||||||||||||||||||||||||
Production | (764 | ) | (412 | ) | (1,072 | ) | (22 | ) | (546 | ) | (3 | ) | (2,819 | ) | ||||||||||||||||||||||||||||
December 31, 2005 | 13,692 | 2,324 | 8,398 | 841 | 7,279 | 821 | 33,355 | |||||||||||||||||||||||||||||||||||
January 1, 2006 | 13,692 | 2,324 | 8,398 | 841 | 7,279 | 821 | 33,355 | |||||||||||||||||||||||||||||||||||
Revisions | (1,179 | ) | 73 | (457 | ) | 170 | 414 | (20 | ) | (999 | ) | (1,179 | ) | 73 | (457 | ) | 170 | 414 | (20 | ) | (999 | ) | ||||||||||||||||||||
Purchases | 19 | — | 38 | — | — | — | 57 | 19 | — | 38 | — | — | — | 57 | ||||||||||||||||||||||||||||
Sales | (57 | ) | (44 | ) | (3 | ) | — | — | — | (104 | ) | (57 | ) | (44 | ) | (3 | ) | — | — | — | (104 | ) | ||||||||||||||||||||
Improved recovery | 12 | — | — | — | — | — | 12 | 12 | — | — | — | — | — | 12 | ||||||||||||||||||||||||||||
Extensions and discoveries | 268 | 10 | 117 | 1 | 2,534 | — | 2,930 | 268 | 10 | 117 | 1 | 2,534 | — | 2,930 | ||||||||||||||||||||||||||||
Production | (706 | ) | (379 | ) | (1,004 | ) | (26 | ) | (644 | ) | (12 | ) | (2,771 | ) | (706 | ) | (379 | ) | (1,004 | ) | (26 | ) | (644 | ) | (12 | ) | (2,771 | ) | ||||||||||||||
December 31, 2006 | 12,049 | 1,984 | 7,089 | 986 | 9,583 | 789 | 32,480 | 12,049 | 1,984 | 7,089 | 986 | 9,583 | 789 | 32,480 | ||||||||||||||||||||||||||||
Revisions | 1,566 | 124 | 375 | (22 | ) | 813 | (43 | ) | 2,813 | 1,566 | 124 | 375 | (22 | ) | 813 | (43 | ) | 2,813 | ||||||||||||||||||||||||
Purchases | 9 | — | — | — | — | — | 9 | 9 | — | — | — | — | — | 9 | ||||||||||||||||||||||||||||
Sales | (19 | ) | (231 | )(2) | (70 | ) | — | — | — | (320 | ) | (19 | ) | (231 | )(2) | (70 | ) | — | — | — | (320 | ) | ||||||||||||||||||||
Improved recovery | — | 1 | — | — | — | — | 1 | — | 1 | — | — | — | — | 1 | ||||||||||||||||||||||||||||
Extensions and discoveries | 208 | 8 | 13 | 81 | — | — | 310 | 208 | 8 | 13 | 81 | — | — | 310 | ||||||||||||||||||||||||||||
Production | (641 | ) | (327 | ) | (895 | ) | (39 | ) | (762 | ) | (19 | ) | (2,683 | ) | (641 | ) | (327 | ) | (895 | ) | (39 | ) | (762 | ) | (19 | ) | (2,683 | ) | ||||||||||||||
December 31, 2007 | 13,172 | 1,559 | 6,512 | 1,006 | 9,634 | 727 | 32,610 | 13,172 | 1,559 | 6,512 | 1,006 | 9,634 | 727 | 32,610 | ||||||||||||||||||||||||||||
Revisions | (1,056 | ) | 88 | (193 | ) | (55 | ) | 1,794 | 57 | 635 | ||||||||||||||||||||||||||||||||
Purchases | — | — | — | — | — | — | — | |||||||||||||||||||||||||||||||||||
Sales | (12 | ) | (17 | ) | (8 | ) | — | — | (24 | ) | (61 | ) | ||||||||||||||||||||||||||||||
Improved recovery | — | — | — | — | — | — | — | |||||||||||||||||||||||||||||||||||
Extensions and discoveries | 229 | 16 | 10 | 12 | 419 | — | 686 | |||||||||||||||||||||||||||||||||||
Production | (555 | ) | (263 | ) | (876 | ) | (45 | ) | (710 | ) | (19 | ) | (2,468 | ) | ||||||||||||||||||||||||||||
December 31, 2008 | 11,778 | 1,383 | 5,445 | 918 | 11,137 | 741 | 31,402 | |||||||||||||||||||||||||||||||||||
Proportional interest in proved reserves of equity companies | ||||||||||||||||||||||||||||||||||||||||||
End of year 2005 | 136 | — | 13,024 | — | 19,119 | 1,273 | 33,552 | |||||||||||||||||||||||||||||||||||
End of year 2006 | 131 | — | 12,551 | — | 21,184 | 1,214 | 35,080 | 131 | — | 12,551 | — | 21,184 | 1,214 | 35,080 | ||||||||||||||||||||||||||||
End of year 2007 | 125 | — | 12,341 | — | 21,733 | 1,453 | 35,652 | 125 | — | 12,341 | — | 21,733 | 1,453 | 35,652 | ||||||||||||||||||||||||||||
End of year 2008 | 112 | — | 11,839 | — | 21,005 | 1,521 | 34,477 | |||||||||||||||||||||||||||||||||||
| (1) | Includes total proved reserves attributable to Imperial Oil Limited of |
| (2) | Includes 219 billion cubic feet of proved reserves in Venezuela which were expropriated. See note 15, Litigation and Other Contingencies. |
A60A59
Natural Gas(continued) | United States | Canada/ South America (1) | Europe | Africa | Asia Pacific/ Middle East | Russia/ Caspian | Total | |||||||
| (billions of cubic feet) | ||||||||||||||
Proved developed reserves, included above, as of December 31, 2005 | ||||||||||||||
Consolidated subsidiaries | 10,386 | 1,840 | 6,332 | 376 | 6,067 | 227 | 25,228 | |||||||
Equity companies | 113 | — | 10,226 | — | 7,276 | 835 | 18,450 | |||||||
Proved developed reserves, included above, as of December 31, 2006 | ||||||||||||||
Consolidated subsidiaries | 9,280 | 1,628 | 5,346 | 823 | 5,882 | 447 | 23,406 | |||||||
Equity companies | 109 | — | 9,985 | — | 7,906 | 811 | 18,811 | |||||||
Proved developed reserves, included above, as of December 31, 2007 | ||||||||||||||
Consolidated subsidiaries | 8,373 | 1,303 | 5,064 | 773 | 5,570 | 395 | 21,478 | |||||||
Equity companies | 104 | — | 9,679 | — | 8,702 | 757 | 19,242 | |||||||
SUPPLEMENTAL INFORMATION ON OIL AND GAS EXPLORATION AND PRODUCTION ACTIVITIES(unaudited)
Natural Gas(continued) | United States | Canada/ South America (1) | Europe | Africa | Asia Pacific/ Middle East | Russia/ Caspian | Total | |||||||
| (billions of cubic feet) | ||||||||||||||
Proved developed reserves, included above, as of December 31, 2006 | ||||||||||||||
Consolidated subsidiaries | 9,280 | 1,628 | 5,346 | 823 | 5,882 | 447 | 23,406 | |||||||
Equity companies | 109 | — | 9,985 | — | 7,906 | 811 | 18,811 | |||||||
Proved developed reserves, included above, as of December 31, 2007 | ||||||||||||||
Consolidated subsidiaries | 8,373 | 1,303 | 5,064 | 773 | 5,570 | 395 | 21,478 | |||||||
Equity companies | 104 | — | 9,679 | — | 8,702 | 757 | 19,242 | |||||||
Proved developed reserves, included above, as of December 31, 2008 | ||||||||||||||
Consolidated subsidiaries | 7,835 | 1,148 | 4,426 | 738 | 6,241 | 362 | 20,750 | |||||||
Equity companies | 96 | — | 9,284 | — | 11,755 | 864 | 21,999 | |||||||
| (1) | Includes proved developed reserves attributable to Imperial Oil Limited of |
INFORMATION ON CANADIAN OIL SANDS PROVEN RESERVES NOT INCLUDED ABOVE
In addition to conventional liquids and natural gas proved reserves, ExxonMobil has significant interests in proven oil sands reserves in Canada associated with the Syncrude project.and Kearl projects. For internal management purposes, ExxonMobil views these reserves and their development as an integral part of total upstream operations. However, for financial reporting purposes, these reserves are required to be reported separately from the oil and gas reserves.
The oil sands reserves are not considered in the standardized measure of discounted future cash flows for conventional oil and gas reserves, which is on the following page.
Oil Sands Reserves | Canada(1) | |
| (millions of barrels) | ||
At December 31, | ||
| 718 | |
At December 31, 2007 | 694 | |
At December 31, 2008 | 1,871 |
| (1) |
A61A60
SUPPLEMENTAL INFORMATION ON OIL AND GAS EXPLORATION AND PRODUCTION ACTIVITIES(unaudited)
Standardized Measure of Discounted Future Cash Flows
As required by the Financial Accounting Standards Board, the standardized measure of discounted future net cash flows is computed by applying year-end prices, costs and legislated tax rates and a discount factor of 10 percent to net proved reserves. The standardized measure includes costs for future dismantlement, abandonment and rehabilitation obligations. The Corporation believes the standardized measure does not provide a reliable estimate of the Corporation’s expected future cash flows to be obtained from the development and production of its oil and gas properties or of the value of its proved oil and gas reserves. The standardized measure is prepared on the basis of certain prescribed assumptions including year-end prices, which represent a single point in time and therefore may cause significant variability in cash flows from year to year as prices change.
Standardized Measure of Discounted Future Cash Flows | United States | Canada/ South America (1) | Europe | Africa | Asia Pacific/ Middle East | Russia/ Caspian | Total | United States | Canada/ South America (1) | Europe | Africa | Asia Pacific/ Middle East | Russia/ Caspian | Total | ||||||||||||||||||||||||||||||
| (millions of dollars) | ||||||||||||||||||||||||||||||||||||||||||||
Consolidated subsidiaries | ||||||||||||||||||||||||||||||||||||||||||||
As of December 31, 2005 | ||||||||||||||||||||||||||||||||||||||||||||
Future cash inflows from sales of oil and gas | $ | 200,119 | $ | 54,953 | $ | 107,127 | $ | 127,584 | $ | 44,411 | $ | 35,757 | $ | 569,951 | ||||||||||||||||||||||||||||||
Future production costs | 34,100 | 14,460 | 19,958 | 21,856 | 12,515 | 5,324 | 108,213 | |||||||||||||||||||||||||||||||||||||
Future development costs | 8,935 | 3,562 | 8,552 | 12,464 | 2,651 | 4,000 | 40,164 | |||||||||||||||||||||||||||||||||||||
Future income tax expenses | 67,581 | 12,343 | 47,999 | 51,610 | 13,151 | 6,608 | 199,292 | |||||||||||||||||||||||||||||||||||||
Future net cash flows | $ | 89,503 | $ | 24,588 | $ | 30,618 | $ | 41,654 | $ | 16,094 | $ | 19,825 | $ | 222,282 | ||||||||||||||||||||||||||||||
Effect of discounting net cash flows at 10% | 53,919 | 10,641 | 9,988 | 15,337 | 6,800 | 12,379 | 109,064 | |||||||||||||||||||||||||||||||||||||
Discounted future net cash flows | $ | 35,584 | $ | 13,947 | $ | 20,630 | $ | 26,317 | $ | 9,294 | $ | 7,446 | $ | 113,218 | ||||||||||||||||||||||||||||||
Proportional interest in standardized measure of discounted future net cash flows related to proved reserves of equity companies | $ | 7,000 | $ | — | $ | 11,043 | $ | — | $ | 34,214 | $ | 7,735 | $ | 59,992 | ||||||||||||||||||||||||||||||
| (millions of dollars) | ||||||||||||||||||||||||||||||||||||||||||||
Consolidated subsidiaries | ||||||||||||||||||||||||||||||||||||||||||||
As of December 31, 2006 | ||||||||||||||||||||||||||||||||||||||||||||
Future cash inflows from sales of oil and gas | $ | 139,843 | $ | 61,187 | $ | 83,854 | $ | 117,068 | $ | 100,751 | $ | 42,264 | $ | 544,967 | $ | 139,843 | $ | 61,187 | $ | 83,854 | $ | 117,068 | $ | 100,751 | $ | 42,264 | $ | 544,967 | ||||||||||||||||
Future production costs | 39,829 | 20,639 | 19,134 | 22,316 | 36,008 | 3,597 | 141,523 | 39,829 | 20,639 | 19,134 | 22,316 | 36,008 | 3,597 | 141,523 | ||||||||||||||||||||||||||||||
Future development costs | 11,134 | 4,023 | 10,245 | 10,429 | 6,098 | 5,307 | 47,236 | 13,664 | 4,023 | 10,245 | 7,037 | 6,098 | 5,307 | 46,374 | ||||||||||||||||||||||||||||||
Future income tax expenses | 42,665 | 12,951 | 34,050 | 48,235 | 35,200 | 8,156 | 181,257 | 41,743 | 12,951 | 34,050 | 50,937 | 35,200 | 8,156 | 183,037 | ||||||||||||||||||||||||||||||
Future net cash flows | $ | 46,215 | $ | 23,574 | $ | 20,425 | $ | 36,088 | $ | 23,445 | $ | 25,204 | $ | 174,951 | $ | 44,607 | $ | 23,574 | $ | 20,425 | $ | 36,778 | $ | 23,445 | $ | 25,204 | $ | 174,033 | ||||||||||||||||
Effect of discounting net cash flows at 10% | 28,428 | 11,429 | 6,464 | 12,069 | 12,777 | 16,932 | 88,099 | 25,755 | 11,429 | 6,464 | 12,381 | 12,777 | 16,932 | 85,738 | ||||||||||||||||||||||||||||||
Discounted future net cash flows | $ | 17,787 | $ | 12,145 | $ | 13,961 | $ | 24,019 | $ | 10,668 | $ | 8,272 | $ | 86,852 | $ | 18,852 | $ | 12,145 | $ | 13,961 | $ | 24,397 | $ | 10,668 | $ | 8,272 | $ | 88,295 | ||||||||||||||||
Proportional interest in standardized measure of discounted future net cash flows related to proved reserves of equity companies | $ | 6,337 | $ | — | $ | 7,952 | $ | — | $ | 27,136 | $ | 8,490 | $ | 49,915 | $ | 6,337 | $ | — | $ | 7,952 | $ | — | $ | 27,136 | $ | 9,858 | $ | 51,283 | ||||||||||||||||
Consolidated subsidiaries | ||||||||||||||||||||||||||||||||||||||||||||
As of December 31, 2007 | ||||||||||||||||||||||||||||||||||||||||||||
Future cash inflows from sales of oil and gas | $ | 216,287 | $ | 49,985 | $ | 115,741 | $ | 184,358 | $ | 158,292 | $ | 64,351 | $ | 789,014 | $ | 216,287 | $ | 49,985 | $ | 115,741 | $ | 184,358 | $ | 162,727 | $ | 64,351 | $ | 793,449 | ||||||||||||||||
Future production costs | 59,154 | 17,422 | 21,356 | 34,721 | 38,098 | 6,537 | 177,288 | 59,154 | 17,422 | 21,356 | 34,721 | 38,343 | 6,537 | 177,533 | ||||||||||||||||||||||||||||||
Future development costs | 13,422 | 5,487 | 10,166 | 21,258 | 5,903 | 7,513 | 63,749 | 18,950 | 5,487 | 10,166 | 13,983 | 6,321 | 7,513 | 62,420 | ||||||||||||||||||||||||||||||
Future income tax expenses | 63,042 | 7,383 | 54,065 | 75,441 | 83,349 | 13,387 | 296,667 | 61,100 | 7,383 | 54,065 | 81,846 | 83,293 | 13,387 | 301,074 | ||||||||||||||||||||||||||||||
Future net cash flows | $ | 80,669 | $ | 19,693 | $ | 30,154 | $ | 52,938 | $ | 30,942 | $ | 36,914 | $ | 251,310 | $ | 77,083 | $ | 19,693 | $ | 30,154 | $ | 53,808 | $ | 34,770 | $ | 36,914 | $ | 252,422 | ||||||||||||||||
Effect of discounting net cash flows at 10% | 51,521 | 7,607 | 9,515 | 20,099 | 14,021 | 25,935 | 128,698 | 46,719 | 7,607 | 9,515 | 20,244 | 16,229 | 25,935 | 126,249 | ||||||||||||||||||||||||||||||
Discounted future net cash flows | $ | 30,364 | $ | 12,086 | $ | 20,639 | $ | 33,564 | $ | 18,541 | $ | 10,979 | $ | 126,173 | ||||||||||||||||||||||||||||||
Proportional interest in standardized measure of discounted future net cash flows related to proved reserves of equity companies | $ | 12,045 | $ | — | $ | 11,041 | $ | — | $ | 53,067 | $ | 18,365 | $ | 94,518 | ||||||||||||||||||||||||||||||
Consolidated subsidiaries | ||||||||||||||||||||||||||||||||||||||||||||
As of December 31, 2008 | ||||||||||||||||||||||||||||||||||||||||||||
Future cash inflows from sales of oil and gas | $ | 104,441 | $ | 22,952 | $ | 71,879 | $ | 74,426 | $ | 70,026 | $ | 20,725 | $ | 364,449 | ||||||||||||||||||||||||||||||
Future production costs | 44,230 | 13,113 | 19,485 | 24,403 | 23,018 | 5,142 | 129,391 | |||||||||||||||||||||||||||||||||||||
Future development costs | 19,828 | 6,156 | 8,765 | 16,064 | 5,717 | 7,913 | 64,443 | |||||||||||||||||||||||||||||||||||||
Future income tax expenses | 17,857 | 961 | 24,729 | 16,870 | 24,932 | 2,203 | 87,552 | |||||||||||||||||||||||||||||||||||||
Future net cash flows | $ | 22,526 | $ | 2,722 | $ | 18,900 | $ | 17,089 | $ | 16,359 | $ | 5,467 | $ | 83,063 | ||||||||||||||||||||||||||||||
Effect of discounting net cash flows at 10% | 13,107 | (239 | ) | 7,602 | 8,052 | 8,222 | 5,750 | 42,494 | ||||||||||||||||||||||||||||||||||||
Discounted future net cash flows | $ | 29,148 | $ | 12,086 | $ | 20,639 | $ | 32,839 | $ | 16,921 | $ | 10,979 | $ | 122,612 | $ | 9,419 | $ | 2,961 | $ | 11,298 | $ | 9,037 | $ | 8,137 | $ | (283 | ) | $ | 40,569 | |||||||||||||||
Proportional interest in standardized measure of discounted future net cash flows related to proved reserves of equity companies | $ | 12,045 | $ | — | $ | 11,041 | $ | — | $ | 53,067 | $ | 15,791 | $ | 91,944 | $ | 2,354 | $ | — | $ | 12,507 | $ | — | $ | 25,494 | $ | 5,094 | $ | 45,449 | ||||||||||||||||
| (1) | Includes discounted future net cash flows attributable to Imperial Oil Limited of |
A62A61
SUPPLEMENTAL INFORMATION ON OIL AND GAS EXPLORATION AND PRODUCTION ACTIVITIES(unaudited)
Change in Standardized Measure of Discounted Future Net Cash Flows Relating to Proved Oil and Gas Reserves
Consolidated Subsidiaries | 2007 | 2006 | 2005 | 2008 | 2007 | 2006 | ||||||||||||||||||
| (millions of dollars) | (millions of dollars) | |||||||||||||||||||||||
Value of reserves added during the year due to extensions, discoveries, improved recovery and net purchases less related costs | $ | (1,680 | )(1) | $ | 14,316 | $ | 4,619 | $ | (303 | ) | $ | (1,680 | )(1) | $ | 14,316 | |||||||||
Changes in value of previous-year reserves due to: | ||||||||||||||||||||||||
Sales and transfers of oil and gas produced during the year, net of production (lifting) costs | (51,093 | ) | (49,732 | ) | (42,606 | ) | (62,685 | ) | (51,093 | ) | (49,732 | ) | ||||||||||||
Development costs incurred during the year | 9,668 | 9,465 | 8,617 | 11,649 | 9,668 | 9,465 | ||||||||||||||||||
Net change in prices, lifting and development costs | 108,967 | (35,342 | ) | 85,049 | (178,960 | ) | 112,237 | (31,890 | ) | |||||||||||||||
Revisions of previous reserves estimates | 15,855 | 9,438 | 9,050 | 7,652 | 15,571 | 9,493 | ||||||||||||||||||
Accretion of discount | 15,267 | 17,368 | 9,021 | 21,463 | 15,632 | 17,368 | ||||||||||||||||||
Net change in income taxes | (61,224 | ) | 8,121 | (41,616 | ) | 115,580 | (62,457 | ) | 6,057 | |||||||||||||||
Total change in the standardized measure during the year | $ | 35,760 | $ | (26,366 | ) | $ | 32,134 | $ | (85,604 | ) | $ | 37,878 | $ | (24,923 | ) | |||||||||
| (1) | Includes impact of expropriation of proved reserves in Venezuela. See note 15, Litigation and Other Contingencies. |
A63A62
| 2007 | 2006 | 2005 | 2004 | 2003 | 2008 | 2007 | 2006 | 2005 | 2004 | ||||||||||||||
| (thousands of barrels daily) | (thousands of barrels daily) | ||||||||||||||||||||||
Production of crude oil and natural gas liquids | |||||||||||||||||||||||
Net production | |||||||||||||||||||||||
United States | 392 | 414 | 477 | 557 | 610 | 367 | 392 | 414 | 477 | 557 | |||||||||||||
Canada/South America | 324 | 354 | 395 | 408 | 411 | 292 | 324 | 354 | 395 | 408 | |||||||||||||
Europe | 480 | 520 | 546 | 583 | 579 | 428 | 480 | 520 | 546 | 583 | |||||||||||||
Africa | 717 | 781 | 666 | 572 | 442 | 652 | 717 | 781 | 666 | 572 | |||||||||||||
Asia Pacific/Middle East | 518 | 485 | 332 | 360 | 386 | 506 | 518 | 485 | 332 | 360 | |||||||||||||
Russia/Caspian | 185 | 127 | 107 | 91 | 88 | 160 | 185 | 127 | 107 | 91 | |||||||||||||
Worldwide | 2,616 | 2,681 | 2,523 | 2,571 | 2,516 | 2,405 | 2,616 | 2,681 | 2,523 | 2,571 | |||||||||||||
| (millions of cubic feet daily) | (millions of cubic feet daily) | ||||||||||||||||||||||
Natural gas production available for sale | |||||||||||||||||||||||
Net production | |||||||||||||||||||||||
United States | 1,468 | 1,625 | 1,739 | 1,947 | 2,246 | 1,246 | 1,468 | 1,625 | 1,739 | 1,947 | |||||||||||||
Canada/South America | 808 | 935 | 1,006 | 1,069 | 1,044 | 640 | 808 | 935 | 1,006 | 1,069 | |||||||||||||
Europe | 3,810 | 4,086 | 4,315 | 4,614 | 4,498 | 3,949 | 3,810 | 4,086 | 4,315 | 4,614 | |||||||||||||
Africa | 26 | — | — | — | — | 32 | 26 | — | — | — | |||||||||||||
Asia Pacific/Middle East | 3,162 | 2,596 | 2,114 | 2,161 | 2,258 | 3,114 | 3,162 | 2,596 | 2,114 | 2,161 | |||||||||||||
Russia/Caspian | 110 | 92 | 77 | 73 | 73 | 114 | 110 | 92 | 77 | 73 | |||||||||||||
Worldwide | 9,384 | 9,334 | 9,251 | 9,864 | 10,119 | 9,095 | 9,384 | 9,334 | 9,251 | 9,864 | |||||||||||||
| (thousands of oil-equivalent barrels daily) | (thousands of oil-equivalent barrels daily) | ||||||||||||||||||||||
Oil-equivalent production(1) | 4,180 | 4,237 | 4,065 | 4,215 | 4,203 | 3,921 | 4,180 | 4,237 | 4,065 | 4,215 | |||||||||||||
| (thousands of barrels daily) | (thousands of barrels daily) | ||||||||||||||||||||||
Refinery throughput | |||||||||||||||||||||||
United States | 1,746 | 1,760 | 1,794 | 1,850 | 1,806 | 1,702 | 1,746 | 1,760 | 1,794 | 1,850 | |||||||||||||
Canada | 442 | 442 | 466 | 468 | 450 | 446 | 442 | 442 | 466 | 468 | |||||||||||||
Europe | 1,642 | 1,672 | 1,672 | 1,663 | 1,566 | 1,601 | 1,642 | 1,672 | 1,672 | 1,663 | |||||||||||||
Asia Pacific | 1,416 | 1,434 | 1,490 | 1,423 | 1,390 | 1,352 | 1,416 | 1,434 | 1,490 | 1,423 | |||||||||||||
Other Non-U.S. | 325 | 295 | 301 | 309 | 298 | 315 | 325 | 295 | 301 | 309 | |||||||||||||
Worldwide | 5,571 | 5,603 | 5,723 | 5,713 | 5,510 | 5,416 | 5,571 | 5,603 | 5,723 | 5,713 | |||||||||||||
Petroleum product sales (2) | |||||||||||||||||||||||
United States | 2,717 | 2,729 | 2,822 | 2,872 | 2,729 | 2,540 | 2,717 | 2,729 | 2,822 | 2,872 | |||||||||||||
Canada | 461 | 473 | 498 | 615 | 602 | 444 | 461 | 473 | 498 | 615 | |||||||||||||
Europe | 1,773 | 1,813 | 1,824 | 2,139 | 2,061 | 1,712 | 1,773 | 1,813 | 1,824 | 2,139 | |||||||||||||
Asia Pacific and other Eastern Hemisphere | 1,701 | 1,763 | 1,902 | 2,080 | 2,075 | 1,646 | 1,701 | 1,763 | 1,902 | 2,080 | |||||||||||||
Latin America | 447 | 469 | 473 | 504 | 490 | 419 | 447 | 469 | 473 | 504 | |||||||||||||
Purchases/sales with the same counterparty included above | — | — | — | (699 | ) | (687 | ) | — | — | — | — | (699 | ) | ||||||||||
Worldwide | 7,099 | 7,247 | 7,519 | 7,511 | 7,270 | 6,761 | 7,099 | 7,247 | 7,519 | 7,511 | |||||||||||||
Gasoline, naphthas | 2,850 | 2,866 | 2,957 | 3,301 | 3,238 | 2,654 | 2,850 | 2,866 | 2,957 | 3,301 | |||||||||||||
Heating oils, kerosene, diesel oils | 2,094 | 2,191 | 2,230 | 2,517 | 2,432 | 2,096 | 2,094 | 2,191 | 2,230 | 2,517 | |||||||||||||
Aviation fuels | 641 | 651 | 676 | 698 | 662 | 607 | 641 | 651 | 676 | 698 | |||||||||||||
Heavy fuels | 715 | 682 | 689 | 659 | 638 | 636 | 715 | 682 | 689 | 659 | |||||||||||||
Specialty petroleum products | 799 | 857 | 967 | 1,035 | 987 | 768 | 799 | 857 | 967 | 1,035 | |||||||||||||
Purchases/sales with the same counterparty included above | — | — | — | (699 | ) | (687 | ) | — | — | — | — | (699 | ) | ||||||||||
Worldwide | 7,099 | 7,247 | 7,519 | 7,511 | 7,270 | 6,761 | 7,099 | 7,247 | 7,519 | 7,511 | |||||||||||||
| (thousands of metric tons) | (thousands of metric tons) | ||||||||||||||||||||||
Chemical prime product sales | |||||||||||||||||||||||
United States | 10,855 | 10,703 | 10,369 | 11,521 | 10,740 | 9,526 | 10,855 | 10,703 | 10,369 | 11,521 | |||||||||||||
Non-U.S. | 16,625 | 16,647 | 16,408 | 16,267 | 15,827 | 15,456 | 16,625 | 16,647 | 16,408 | 16,267 | |||||||||||||
Worldwide | 27,480 | 27,350 | 26,777 | 27,788 | 26,567 | 24,982 | 27,480 | 27,350 | 26,777 | 27,788 | |||||||||||||
Operating statistics include 100 percent of operations of majority-owned subsidiaries; for other companies, crude production, gas, petroleum product and chemical prime product sales include ExxonMobil’s ownership percentage and refining throughput includes quantities processed for ExxonMobil. Net production excludes royalties and quantities due others when produced, whether payment is made in kind or cash.
| (1) | Gas converted to oil-equivalent at 6 million cubic feet = 1 thousand barrels. |
| (2) | 2008, 2007, 2006 and 2005 petroleum product sales data reported net of purchases/sales contracts with the same counterparty. |
A64A63
STOCK PERFORMANCE GRAPHS(unaudited)
Annual total returns to ExxonMobil shareholders were 39 percent in 2006, 24 percent in 2007, 39and negative 13 percent in 2006, 12 percent in 2005,2008, and have averaged over 24more than 16 percent per year over the past five years. Total returns mean share price increase plus dividends paid, with dividends reinvested. The graphs below show the relative investment performance of ExxonMobil common stock, the S&P 500, and an industry competitor group over the last five and 10 years. The industry competitor group consists of three other international integrated oil companies: BP, Chevron, and Royal Dutch Shell.
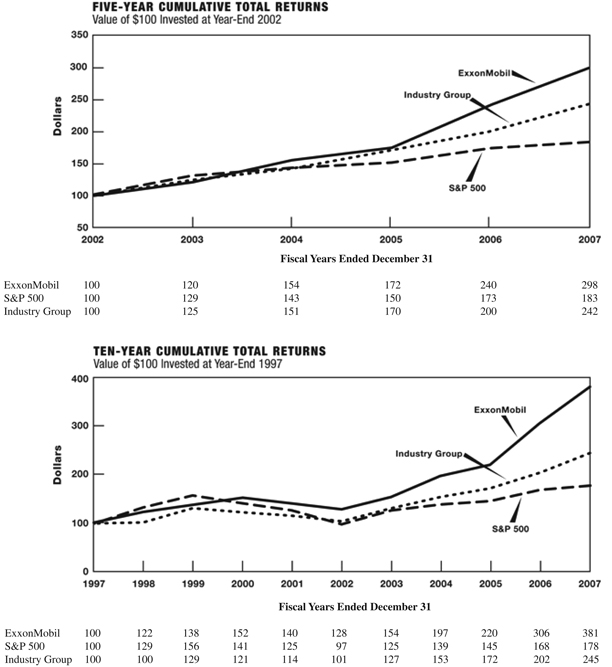
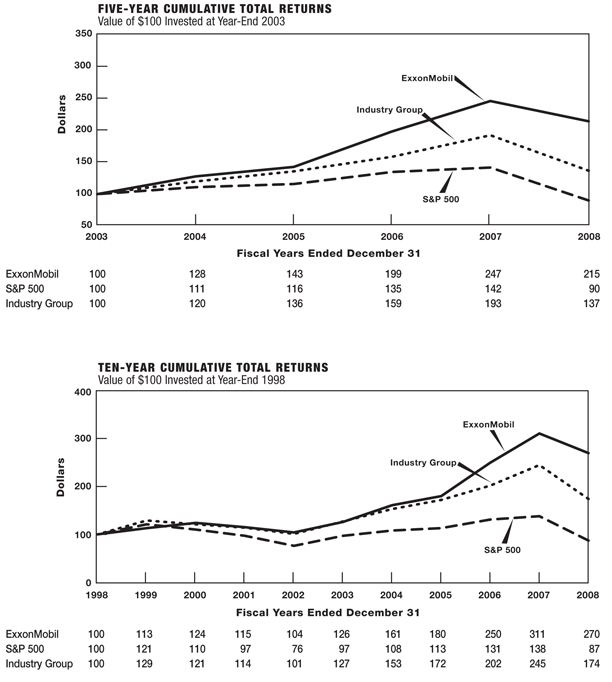
A65A64
ExxonMobil 20082009 Annual Meeting
Wednesday, May 28, 200827, 2009
9:00 a.m., Central Time
Morton H. Meyerson Symphony Center
2301 Flora Street
Dallas, Texas 75201

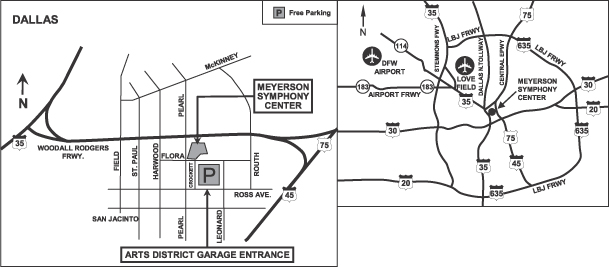
| Ÿ | Free parking is available at the Arts District Garage. Traffic in the area may cause a delay; please allow extra time for parking. |
| Ÿ | From I-45/Hwy. 75 – Take I-35E exit (Woodall Rodgers Frwy.) to Pearl Street exit or St. Paul exit (follow frontage road east to Pearl Street), turn south and continue to Ross Avenue, turn left to the Arts District Garage. |
| Ÿ | From I-35E – Take I-45/Hwy. 75 exit (Woodall Rodgers Frwy.) to Pearl Street exit, continue to Ross Avenue, turn left to the Arts District Garage. |
| Ÿ | From DFW Airport – Take South exit to Hwy. 183 East (merges with I-35E), follow directions from I-35E (above). |
| Ÿ | From Love Field – Exit airport on Mockingbird Lane west to I-35E South, follow directions from I-35E (above). |
| Printed entirely on recycled paper |
|  | |||||||||
| Electronic Voting Instructions You can vote by Internet or telephone Available 24 hours a day, 7 days a week Instead of mailing your proxy, you may choose one of the two voting methods outlined below to vote your proxy. Validation details are located in the shaded bar below. Please vote immediately. Your vote is important. | |||||||||
 | Vote by Internet | |||||||||
Ÿ | Log on to the Internet and go to www.investorvote.com/exxonmobil | |||||||||
Ÿ | Follow the steps outlined on this secured Web site. | |||||||||
 | Vote by telephone | |||||||||
Ÿ | Call toll-free 1-800-652-VOTE (8683) from a touch-tone telephone. There isNO CHARGEfor this call. | |||||||||
Using ablack ink pen, mark your votes with anX as shown in this example. Please do not write outside the designated areas. | Ÿ | Call 1-781-575-2300 outside the U.S., Canada & Puerto Rico from a touch-tone telephone. Place your call through an operator and we will accept the charge for this call. | ||||||||
| x | Ÿ | Follow the instructions provided by the recorded message. | ||||||||


| q IF YOU HAVE NOT VOTED VIA THE INTERNETOR TELEPHONE, FOLD ALONG THE PERFORATION, DETACH AND RETURN THE BOTTOM PORTION IN THE ENCLOSED ENVELOPE. q | ||||
| A | VOTING ITEMS | |||||
| The Directors recommend a voteFOR items 1 and 2 below. | The Directors recommend a voteAGAINST shareholder proposal items 3 through 13 below. É | |||||||||||||||||||||||||||||||||
| 1. Election of Directors (page 13): | ||||||||||||||||||||||||||||||||||
| 01 - M.J. Boskin, 02 - L.R. Faulkner, 03 - K.C. Frazier, | ||||||||||||||||||||||||||||||||||
| 04 - W.W. George, 05 - R.C. King, 06 - M.C. Nelson, | For | Against | Abstain | For | Against | Abstain | ||||||||||||||||||||||||||||
| 07 - S.J. Palmisano, 08 - S.S Reinemund, | 3. | Cumulative Voting (page 51) | ¨ | ¨ | ¨ | 9. | Corporate Sponsorships Report (page 60) | ¨ | ¨ | ¨ | ||||||||||||||||||||||||
| 09 - R.W. Tillerson, 10 - E.E. Whitacre, Jr. | ||||||||||||||||||||||||||||||||||
¨ |
FOR all nominees |
4. |
Special Shareholder Meetings (page 53)
| ¨ | ¨ | ¨ |
10. |
Amendment of EEO Policy (page 62) | ¨ | ¨ | ¨ | |||||||||||||||||||||||
| ¨ | WITHHOLD vote from all nominees | 5. | Incorporate in North Dakota (page 54)
| ¨ | ¨ | ¨ | 11. | Greenhouse Gas Emissions Goals (page 63) | ¨ | ¨ | ¨ | |||||||||||||||||||||||
¨ |
For AllEXCEPT- To withhold a vote from one or more nominees, mark the box to the left and the corresponding numbered box(es) below. | 6. | Board Chairman and CEO (page 55)
| ¨ | ¨ | ¨ | 12. | Climate Change and Technology Report (page 65) | ¨ | ¨ | ¨ | |||||||||||||||||||||||
| 7. | Shareholder Advisory Vote on Executive Compensation (page 57)
| ¨ | ¨ | ¨ | 13. | Renewable Energy Policy (page 66) | ¨ | ¨ | ¨ | |||||||||||||||||||||||||
| 01 - | ¨ | 02 - | ¨ | 03 - | ¨ | 04 - | ¨ | |||||||||||||||||||||||||||
| 05 - | ¨ | 06 - | ¨ | 07 - | ¨ | 08 - | ¨ | 8. | Executive Compensation Report (page 59) | ¨ | ¨ | ¨ | ||||||||||||||||||||||
| 09 - | ¨ | 10 - | ¨ | |||||||||||||||||||||||||||||||
| For | Against | Abstain | ||||||||
2. Ratification of Independent Auditors (page 50) | ¨ | ¨ | ¨ |
If voting by mail, this proxy must be signed on the reverse side.
| ¢ |  | É |
<STOCK#> 00ZYDR
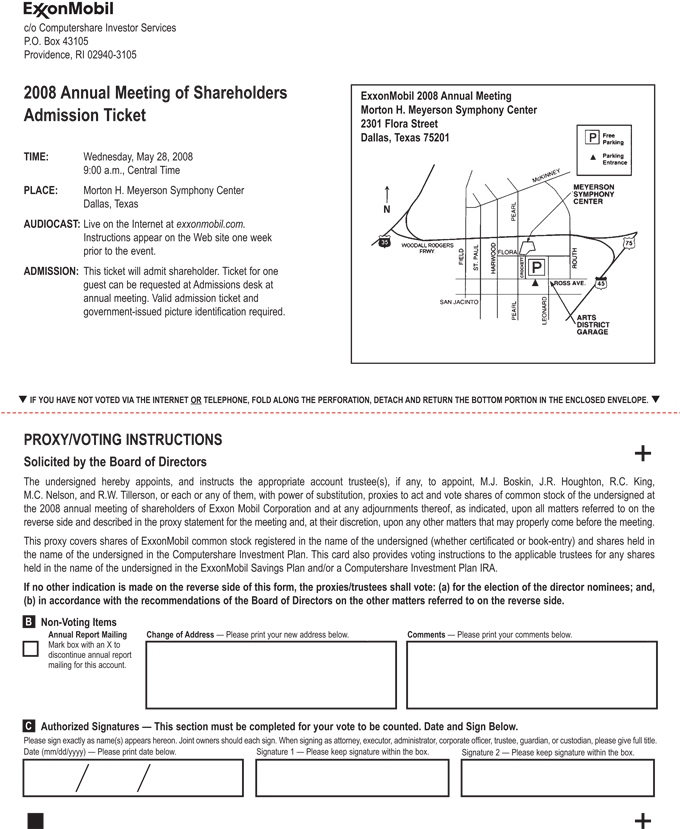

c/o Computershare Investor Services P.O. Box 43105 Providence, RI 02940-3105 |
2009 Annual Meeting of Shareholders Admission Ticket |
| |||
TIME: | Wednesday, May 27, 2009 9:00 a.m., Central Time | |||
PLACE: | Morton H. Meyerson Symphony Center 2301 Flora Street Dallas, Texas 75201 | |||
AUDIOCAST: | Live on the Internet atexxonmobil.com. Instructions appear on the Web site one week prior to the event. | |||
ADMISSION: | This ticket will admit shareholder. Ticket for one guest can be requested at Admissions desk at annual meeting. Valid admission ticket and government-issued picture identification required. | |||
| q IF YOU HAVE NOT VOTED VIA THE INTERNETOR TELEPHONE, FOLD ALONG THE PERFORATION, DETACH AND RETURN THE BOTTOM PORTION IN THE ENCLOSED ENVELOPE. q | ||||
PROXY/VOTING INSTRUCTIONS Solicited by the Board of Directors | É | |
The undersigned hereby appoints, and instructs the appropriate account trustee(s), if any, to appoint, M.J. Boskin, W.W. George, R.C. King, M.C. Nelson, and R.W. Tillerson, or each or any of them, with power of substitution, proxies to act and vote shares of common stock of the undersigned at the 2009 annual meeting of shareholders of Exxon Mobil Corporation and at any adjournments thereof, as indicated, upon all matters referred to on the reverse side and described in the proxy statement for the meeting and, at their discretion, upon any other matters that may properly come before the meeting. This proxy covers shares of ExxonMobil common stock registered in the name of the undersigned (whether certificated or book-entry) and shares held in the name of the undersigned in the Computershare Investment Plan. This card also provides voting instructions to the applicable trustees for any shares held in the name of the undersigned in the ExxonMobil Savings Plan and/or a Computershare Investment Plan IRA. If no other indication is made on the reverse side of this form, the proxies/trustees shall vote: (a) for the election of the director nominees; and, (b) in accordance with the recommendations of the Board of Directors on the other matters referred to on the reverse side. | ||
| B | Non-Voting Items | |||||
| ¨ | Annual Report Mailing Mark box with an X to | Change of Address — Please print your new address below. | Comments — Please print your comments below. | |||||
discontinue annual report mailing for this account. |
| C | Authorized Signatures — This section must be completed for your vote to be counted. Date and Sign Below. | |||||
| Please sign exactly as name(s) appears hereon. Joint owners should each sign. When signing as attorney, executor, administrator, corporate officer, trustee, guardian, or custodian, please give full title. |
| Date (mm/dd/yyyy) — Please print date below. | Signature 1 — Please keep signature within the box. | Signature 2 — Please keep signature within the box. | ||||||
| // |
| ¢ | É |